How large are British Columbia's reserves of natural gas? The answer is complicated because in resource exploration there are different definitions of what is meant by the term "reserves".
- Proven reserves capture the quantity of natural gas that can be recovered with existing technology and which has been estimated with a high degree of certainty. Reserves that do not mean this level of certainty are considered unproven reserves.
- Probable reserves are unproven reserves where the engineering estimates only provide a 50% confidence of being recoverable.
- Possible reserves are further unproven reserves that have only a 10% level of confidence for being recoverable. The sum of proven, probable, and possible reserves is sometimes referred to as "P3" reserves.
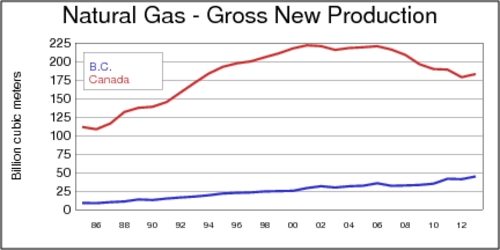
Canada's overall production of natural peaked during the last decade at almost 225 billion cubic meters but has since declined a little. Britih Columbia's output of natural gas continues to increase and has climbed to over 44 billion cubic meters in 2013. These amounts are gross new production, but there are various losses before natural gas reaches its markets. Some of the natural gas is reinjected, and other portions are flared or vented. In 2013, British Columbia produced only 31 billion cubic metres of marketable natural gas, roughly 70% of gross new production. Overall, Canada is the fifth-largest producer of dry natural gas.

To appreciate the magnitude of the British Columbia natural gas reserves, it is useful to put them into perspective both in terms of quantity and quality. Quantity obviously matters in terms of economic value. However, quality also matters because of the difficulty and cost of extraction as well as the environmental impacts.
Natural Gas Quantity
The US Energy Information Administration (EIA) reports on Canada's natural gas proved reserves. In 1985 there were as high as 2.8 trillion cubic meters, but by 2014 have fallen to 1.9 trillion cubic meters. Most of Canada's natural gas reserves are traditional resources in the Western Canada Sedimentary Basin (WCSB), which is associated most closely with the Alberta oil sands. It has been reported that Canada possesses vast reserves of technically recoverable shale gas resources, which at this point constitute unproven reserves. Canada's overall reserves of shale gas are estimated by the EIA at 16.2 trillion cubic meters. That is about 8% of the world total, and it amounts to over 30 times Canada's proven reserves. Canada is the fifth largest country with such reserves after China, Argentina, Algeria, and the United States.
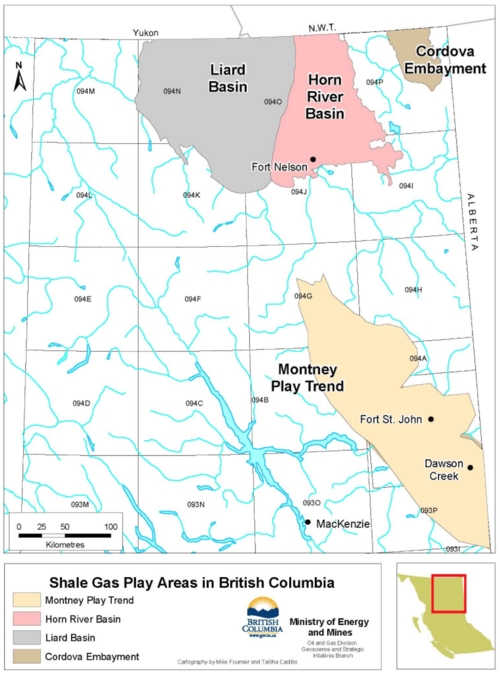
In Canada, five large sedimentary basins in British Columbia and Alberta account for nearly all of Canada's shale gas reserves: the Horn River basin near Fort Nelson; the Cordova Embayment near the borders of BC, Alberta, and the Northwest Territories; the Liard Basin west of Fort Nelson (BC); and the Deep Basin Montney and Doig Basin subcrops around Fort St. John (BC), Dawson Creek (BC), and Grande Prairie (AB). The Liard Basin is considered the largest of the five, and most of it resides in British Columbia. The map below identifies the regions.

Natural Gas Quality
First, it is useful to clarify some of the terminology that is used in the natural gas industry for unconventional resources of natural gas. The term shale gas is is used for natural gas that resides in shales. The term tight gas is more general and allows for natural gas reserves in tight formations other than shale, namely sandstones and carbonate rocks. Often, these two terms are used interchangeably, although there is a slight difference in meaning. In addition to tight gas there is also coalbed methane (CBM) that comes, as the name suggests, from coal beds. This gas is also known as sweet gas because of its lack of hydrogen sulfide (which is also known as sour gas). CBM also contains few other hydrocarbons such as butane or propane, but it can contain several percent of carbon dioxide. Because of the lack of impurities, CBM is generally considered to be cleaner than conventional natural gas.
Shale gas and CBM are both produced through hydraulic fracturing, or fracking. However, CBM recovery also requires de-watering the coal in order to decrease the natural pressure in the coal. This process generates produced water. Fracking requires the high-pressure injection of a mix of fluids into a well that opens cracks in the the rock formations and keeps them open using proppants (mostly sand or aluminium oxide). However, various chemicals and biocides may also be added into the fracturing fluid.
Produced Water is a byproduct of natural gas (and oil) extraction. This water, which resides in the well, is extracted along with the natural gas. This water is briny: it contains many disolved salts and minerals. It was often disposed of in large evaporation ponds, but recent practice has moved towards underground injection and water treatment. A significant amount of this water returns to the surface as so-called "flowback" within the first few days to weeks after injection and is accompanied by large quantities of methane.
Methane Leakage is a significant problem because methane is a more potent greenhouse gas than carbon dioxide—its global warming potential is at least 20 times larger over a 100-year time horizon. (The US EPA and the UNFCC put the global warming potential equivalence factor at 21, while recent sources put the equivalence factor at 28-34.) Methane leaks arise from flowbacks at newly drilled and completed wells, from pneumatic pumps, from equipment leaks, and from pipeline leaks. A recent study in Science suggests that methane leakage has been significantly underestimated in the past. The US EPA puts methane leakage at 1.65%, imputed from their data. The Brandt et al. (2013) study in Science puts methane leakage in the 3.6-7.1% range, and a study by Howarth et al. (2011) puts it in the 3.6-7.9% range for shale gas (and 1.7-6.0% for conventional gas).
A life cycle analysis prepared by (S&T)2 consultants for Natural Resources Canada compares the emissions from shale gas and coal, and a meta study by ICF Consulting compares several studies. Even the Howarth et al. study does not claim that coals is cleaner than natural gas. These two studies criticize the Howarth et al. (2011) study for methodological shortcomings. The meta study finds that life-cycle emissions of GHG are about 62 grams of CO2 per Megajoule, and about 112 grams of CO2 per Megajoule for coal. Importantly, it is claimed that methane emissions from well completion are flared rather than vented in Canada, which would reduce the climate impact significantly.
Carbon Dioxide Venting occurs as a controlled release into the atmosphere at the well head. Methane accounts for only 70-90% of the raw gas, and raw gas can contain more than 2% carbon dioxide, especially for unconventional sources. Carbon dioxide can be separated from methane with scrubbers or membranes. As there is no other use for the captured gas, releasing it into the atmosphere is the easiest option.
‘Upstream methane leakage needs to be reduced significantly.’
To summarize, upstream issues of natural gas production are potentially quite serious in terms of their overall climate change impact. More research is needed in light of recent new evidence. Carbon dioxide venting and flaring combined with methane leakage may call into question some of the benefits of natural gas as a cleaner energy source than coal. In order to harness the full benefits of natural gas, upstream methane leakage needs to be reduced significantly. While on balance, life cycle analysis still gives natural gas an advantage over coal, this advantage can and should be maximized by applying best-of-class technologies and practices to prevent methane leakage.
- ICF Consulting Canada: Life Cycle Greenhouse Gas Emissions of Natural Gas, A Literature Review of Key Studies Comparing Emissions from Natural Gas and Oil, prepared for the Canadian Natural Gas Initiative, December 2012.
- (S&T)2 Consultants: Shale Gas Update for GHGenius, August 2011.
- A.R. Brandt et al. Methane Leaks from North American Natural Gas Systems, Science, 14 February 2014, pp. 733-735
- Robert W. Howarth: A bridge to nowhere: methane emissions and the greenhouse gas footprint of natural gas, Energy Science & Engineering, April 2014.
- Robert W. Howarth et al.: Methane and the greenhouse-gas footprint of natural gas from shale formations, Climatic Change 106(4), June 2011, pp. 679-690.