Is the Canadian Dollar a petrodollar? If you had asked me this question in the 1990s, I would have said "only a little". At the time, commodity prices were not generally thought to be primary drivers of the exchange rate. During that decade, oil prices were relatively flat and thus the observable variation in the exchange rate was driven by other factors. Most international economists, including those at the Bank of Canada who have a professional interest in this question, were indeed puzzled to find that the CAD/USD exchange rate was difficult to predict based on fundamental factors.
While I was researching oil prices for another issue, I had another look at the relationship between oil prices and the CAD/USD exchange rate, and was indeed a bit surprised how much the oil price matters for determining the value of the Canadian Dollar. As two diagrams show below, there can be little question that during the last fifteen years the Canadian Dollar has morphed into a "petrocurrency".
In simple terms, a petrocurrency is a currency of an oil-producing country—such as Canada—whose oil exports as a share of total exports are sufficiently large that the value of that country's currency rises and falls along with the price of oil. In other words, a petrocurrency appreciates when the oil price rises and depreciates when the oil price falls.
Using weekly data, the diagram below traces the movement of the Canadian Dollar against the US Dollar over the last fifteen years, from 2000 to 2014, with the red line. The Canadian Dollar moves as low as 62 cents US in 2002 and as high as 108 cents US in 2007, a dramatic increase of over 70%. And now compare this movement to the price of oil as captured by the West Texas Intermediate (WTI) index, the key benchmark for North American oil. (Canada's exports of heavy crude follow another benchmark, Western Canadian Select, but are closely tied to WTI.) By the end of 2001, WTI prices hover around $20 per barrel, while during its peak, oil prices reach $120 per barrel, only to fall off the cliff during the financial crisis to below $40 per barrel. Throughout the economic recovery, oil prices climb back up to about $100 per barrel, and during late 2014 they fall again to under $60 per barrel. Scaled similarly as in the diagram, the close relationship between the Canadian Dollar's exchange rate and the price of oil becomes visible.
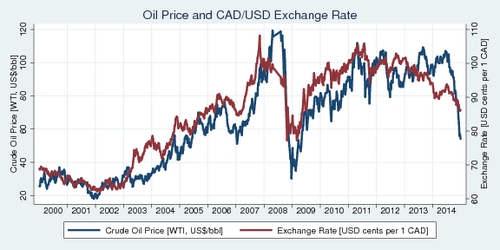
Click on the image to enlarge and view as a printable PDF file.
‘Nine-tenth of the variation in the US-Canadian exchange rate can be explained by oil price changes.’
We can push the analysis a little further. The next chart takes the same data and arranges it so that we can see the correlation between oil price and exchange rate. The red line through the data points shows the simple linear fit—a regression line with just an intercept and slope. The R-square of this regression is remarkably strong: 0.85. It improves to 0.91 if one regresses the log exchange rate on the log oil price, reflecting the relative rather than absolute nature of prices. What that means is that about nine-tenth of the variation in the US-Canadian exchange rate can be explained by oil price changes. That is truly remarkable.
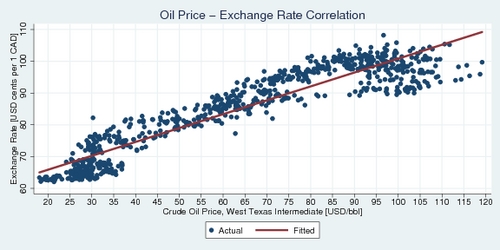
Click on the image to enlarge and view as a printable PDF file.
Perhaps some of the technical details of the above regression analysis may be of interest. The simple linear regression of exchange rate on the US$ WTI price produces an intercept of 58.1 and a slope of 0.417. What that means is that every dollar (US) increase in the WTI price for crude oil leads to an appreciation of the Canadian dollar of 0.417 cents (US). We can also use this regression to predict exchange rates. At a WTI index of US$100, a Canadian Dollar should buy about 99.8 US cents, while at a WTI index of US$60, a Canadian Dollar should buy only about 83.12 cents US.
‘A 10% increase in oil prices translates into a 3% appreciation of the Canadian Dollar’
Rather than using a simple linear regression, we can also improve the analysis slightly by regressing the log exchange rate on the log oil price. Thus we obtain an elasticity as the slope estimate: 0.301. This means that a 10% increase in oil prices translates into a 3% appreciation of the Canadian Dollar. This log-linear regression offers a better fit than the simple linear regression. And for the econometricians among you it should be obvious that the slope estimates are hugely significant statistically (the t-statistics are 66 and 88, respectively).
The diagram above establishes the oil price link convincingly. The Canadian Dollar has become a petrocurrency, like it or not. Economists have been tracing this change, but perhaps have not fully come to terms with the significance of the link. Influential work by two Bank of Canada economists, Robert Amano and Simon van Norden, established in 1992-95 that oil price increases predicted a depreciation of the Canadian Dollar until the 1990s. Even in 2005, an article by Bailliu and King in the Bank of Canada Review stated that ‘Models of exchange rate determination based on macroeconomic fundamentals have not had much success in explaining, let alone forecasting, exchange rate movements.’ Helliwell et al. (2004) dismiss the idea of influences from energy prices and incorporate only two long-run fundamental variables into their "NEMO equation" for predicting the nominal exchange rate of the Canadian Dollar: non-energy commodity prices and labour productivity differentials vis-à-vis the United States. A Department of Finance study by Martin Charron in 2001 also looked at additional fundamental determinants: net foreign asset holdings by Canadians, and computer prices. Around the middle of 2000s decade, thinking was shifting to a larger role of energy prices, however. Work by Issa et al. (2006) found a structural break in the 1990s with respect to the Amano/van Norden exchange rate equation, which explicitly allowed for oil prices.
Perhaps the largest setback in the analysis came through a study by three eminent macroeconomists. Ferraro, Rogoff and Rossi (2012) find “little systematic relation between oil prices and the exchange rate at the monthly and quarterly frequencies” for the Canadian/U.S. dollar exchange rate. They use a sophisticated analytic methodology that looks at changes in exchange rates rather than at levels, and they investigate data from 1972-2008 at the daily, monthly, and quarterly level. How is it possible that these macroeconomists missed the obvious? The answer is simple: they looked at the wrong time horizon, the years before 2000 when oil prices mostly did not matter. They stopped in 2008 when the gyrations of oil prices and exchange rate provided large amounts of new variation to analyze. When Issa et al. found a structural break in their data, they were on the right track. The link between oil prices and exchange rates had shifted because the Canadian economy had shifted.
How much the picture has changed since the beginning of the millennium becomes clear in the next diagram, which shows the percentage share of energy in total merchandise trade (exports plus imports). During the 1980s and 1990s, energy's share in trade hovered around the five percent mark. That changed when Canada entered into the 21st century. By 2014, energy's share nearly tripled to about 15%. This is even more pronounced when one only looks at exports, where that share has reached 25% by 2014. That is what has fundamentally shifted and can explain why oil prices matter a whole lot more than a decade or two earlier.
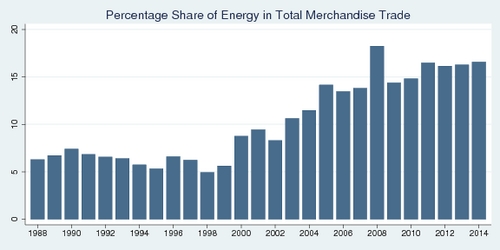
Click on the image to enlarge and view as a printable PDF file.
It is not only the share of energy trade that matters, but also its direction. Canada is both an oil exporter and an oil importer. Western Canada exports oil, while much of Eastern Canada imports oil. From a balance of trade perspective, an oil price change should not affect the exchange rate if exports and imports are balance. Let's say the oil price goes down 10%. Then revenue from oil exports fall 10%, but the expenditures on importing oil fall by 10% as well. When exports dominate the picture, we can expect the currency to appreciate, while when imports dominate, we should expect the currency to depreciate. The diagram below shows how crude oil exports and imports have developed since 1988. Originally, oil trade was small in volume and relatively balanced. Since the start of the millennium, the picture has changed due to the massive expansion of the oil sands in Alberta (and a smaller extent the offshore fields off the coast of Newfoundland). Canada has clearly become an oil export nation.
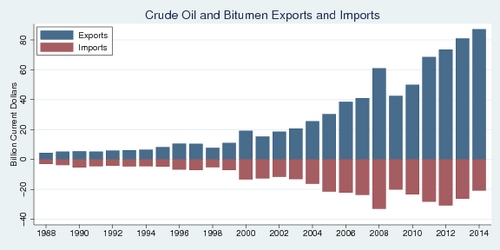
Click on the image to enlarge and view as a printable PDF file.
Can we expect the Canadian Dollar to remain a petrocurrency for the foreseeable future? I think the answer is yes—if oil production remains stable or even increases as oil prices recover from their lows. Then it is even possible that the oil-price exchange-rate elasticity may even become larger, as the Canadian Dollar becomes even more susceptible to changes in this commodity price. What that means for Canadian consumers is: watch the oil price carefully. By way of a strong Dollar, high oil prices will be good for Canadian consumers who import goods and for tourists, but not so good for Canada as a manufacturing base—and employment. And if you are a motorist, high oil prices will mean higher prices at the pump.
And lastly, now that we have established a strong link between oil prices and the USD/CAD exchange rate, has that exchange rate become more predictable? The answer is probably no: we still have to predict the oil price, and that is probably as hard as it has been to predict exchange rates. But at least we understand the dynamics better than before.
Returning to the Ferraro, Rogoff and Rossi (2012) paper, what could they have done better? How can we advance our understanding of exchange rate economics? The error in their paper was that they assumed the structure of the Canadian economy to be static. The effect of commodity prices depens both on their overall share in total trade and the direction of that trade. Technically, the effect of commodity prices should have been interacted with variables that capture these structural changes in the economy. There is a new research paper waiting to be written.
Data Sources and References:
- Exchange rate data were obtained from the Pacific Exchange Rate Service
- Oil prices are from the Spot Prices — Petroleum & Other Liquids, US Energy Information Administration.
- Mechandise trade data were obtained from Statistics Canada CANSIM table 228-0059, unadjusted seasonally and on customs basis.
- Jeannine Bailliu and Michael R. King: What Drives Movements in Exchange Rates, Bank of Canada Rview, Autumn 2005, pp. 27-39.
- R. Amano and S. van Norden: "A Forecasting Equation for the Canada-U.S. Dollar Exchange Rate", in The Exchange Rate and the Economy, Proceedings of a conference held at the Bank of Canada, June 1992.
- Robert A. Amano and Simon van Norden: Exchange Rates and Oil Prices, Bank of Canada Working Paper 95-8, 1995.
- John F. Helliwell, Ramzi Issa, Robert Lafrance, and Qiao Zhang: NEMO: An Equation for the Canadian Dollar, in Canada and the Global Economy, Proceedings of a conference held at the Bank of Canada, November 2004, pp. 101-150.
- Martin Charron: A Medium-Term Forecasting Equation for the Canada-U.S. Real Exchange Rate, Government of Canada, Department of Finance, 2001-08.
- Ramzi Issa, Robert Lafrance, and John Murray: The Turning Black Tide: Energy Prices and the Canadian Dollar, Bank of Canada Working Paper 2006-29, August 2006.
- Domenico Ferraro, Ken Rogoff, and Barbara Rossi: Can Oil Prices Forecast Exchange Rates?, NBER Working Paper No. 17998, April 2012.
- Geoffrey Morgan: The petrodollar effect: Just how much is the loone tied to oil prices?, Financial Post, November 27, 2014