Gasoline prices in Vancouver have been mostly going up over the last decades, despite the recent respite. The large drop in oil prices in late 2014 has raised some interesting questions, and one of them is how crude oil prices affect the price at the pump that you and I pay when we fill up our tank. In short, when the oil price drops by a dollar per barrel, how much less should you expect to pay at the pump?
The answer to that question depends on a number of things, and there are some things that have changed over time. The price at the pump is determine not only by the price of crude oil but also by the cost of transportation, refining, storage, retailing, and market structure. And on top of these cost factors is the level of taxes, which varies hugely across jurisdictions. The total amount of taxes on gasoline in Calgary tend to be just about half of those in Vancouver.
Questions about cost-to-price passthrough are important to economists and have been studied widely. Gasoline prices have caught a lot of attention because there is only one major input into the cost, crude oil prices, and because gasoline is a homogenous commodity. It's an ideal area for study. But even more importantly, the price of gasoline is on every motorist's mind. Ask a motorist about today's price of gasoline and you're bound to get an answer that is quite spot on. Ask the same motorist about the price of a litre of milk, and you're none the wiser.
I have analyzed fifteen years of weekly data from 2000 through 2014. The first chare below shows the general upward trend in gasoline prices. Clearly visible are also the seasonal cycles: fuel prices are higher in the summer (the "driving season") than the winter. The big dip in fuel prices in late 2008 marks the onset of the global recession. In a short period of time, gasoline prices dropped from nearly 150 cents per litre to as low as 80 cents per litre.
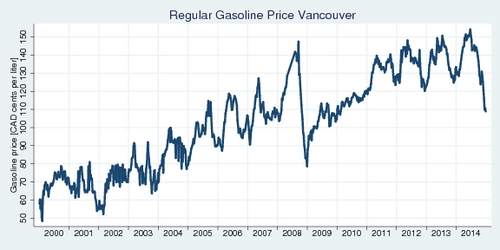
Click on the image to enlarge and view as a printable PDF file.
‘A US$1/barrel increase in the price of crude oil increases the price at the pump for gasoline in Vancouver by about a half-cent per litre.’
Next I have run a few simple regressions to identify the link between crude prices and the price at the pump. The relevant crude price for Western Canada is the West Texas Intermediate (WTI) index, expressed in US Dollars per barrel. I allow for a time trend that captures changes in production and distribution costs, as well as regulatory changes (higher fuel taxes, carbon taxes). The diagram and the table below show the results of this analysis. As you would expect, there is a very strong correlation between crude prices and the price at the pump. The simple model explains over 90% of the variation in the data. The diagram shows both the actual weekly data points (blue dots) and the fitted values from the regression (red line). I have tested two versions of the model: a simple linear model where prices are in cents, and a log-linear version.
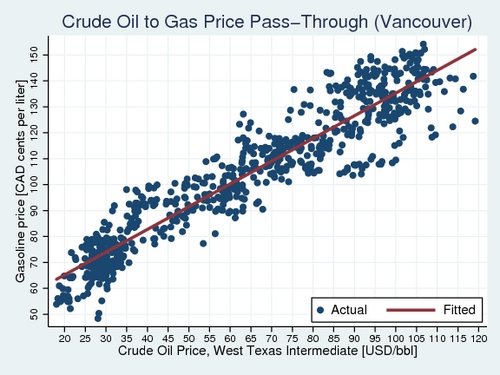
Click on the image to enlarge and view as a printable PDF file.
| Dependent Variable |
Gasoline Price (cents) |
Log of Gasoline Price |
|---|---|---|
| Intercept | 51.047c(81.6) | 3.084c(90.3) |
| WTI Price of Crude Oil | 0.523c(30.7) | 0.337c(32.7) |
| Time Trend (annual) | 2.552c(22.2) | 0.021c(17.4) |
| R2 of Ordinary Least Squares | 0.9272 | 0.9290 |
Estimates shown are based on 779 weekly data points of retail gasoline prices in Vancouver and WTI crude oil prices (in US Dollars) for the time period 2000 through 2014. Time trend is expressed in years since January 1, 2000. Numbers in parentheses show z scores, and the superscripts a, b, and c indicate statistical significance at the 95%, 99%, and 99.9% levels of significance, respectively.
The results of the linear model suggest that gasoline prices rise about 2.6 cents per year due to changes in costs and taxes. An increase of crude oil prices by US$1 per barrel translates into an increase in prices at the pumps in Vancouver by about a half cent. Or put another way, when the WTI index drops by US$10 per barrel, you should expect the price of gasoline in Vancouver to drop by about 5 cents. Another way to describe this relationship is through a log-linear model. In this case the estimated coefficient is an elasticity. A 10% increase in the price of crude oil translates into a 3.4% increase in the price at the pump. The "pass-through elasticity", as it is called technically, is 0.34.
Deviations from the long-term relationship
The scatter plot above shows that there is a very strong correlation between crude oil prices and retail gasoline prices, but it is not a perfect relationship. The blue dots are scattered above and below the red line. The next diagram illustrates how far off these points can be. The histogram below shows the frequency with which plus and minus deviations from the "predicted value" can be. Technically, these deviations are the residuals from the gasoline price regression discussed earlier.
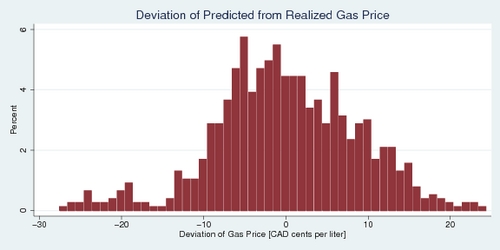
Click on the image to enlarge and view as a printable PDF file.
The histogram above illustrates that price deviations of +/-11 cents from the predicted "long-term" price are quite common—only 10% of the time the deviations are larger. On average, gasoline prices are about 5-6 cents off from their predicted long-term price. The presence of these deviations suggests that price dynamics may be at work: adjustments are slow because of existing inventory. There may also be market structure effect at work. The histogram is not entirely symmetric. It looks as if price deviations are slighly right-skewed.
What about the exchange rate?
You will have noticed that my analysis above quoted crude oil prices in US Dollars per barrel, and the price at the pump in Canadian Dollars per litre. What about the USD/CAD exchange rate that is hidden in this? Technically, [CAD/L] equals [USD/bbl] divided by 159 [L/bbl] divided by the [USD/CAD] exchange rate. If the oil price went down by 10%, and the Canadian Dollar went down by 10% as well, the effect on the price at the pump would be nil. As i discussed in my April 1 blog, there is indeed a strong correlation between the oil price and the CAD/USD exchange rate. But that effect is not one-to-one; it is only about 30%. A 10% decrease in the oil price appears to depreciate the Canadian Dollar by about 3%, and that means prices at the pump will be affected. As shown above, a 10% drop in the oil price would lower the prices at the pump by about 3.3%. The analysis above already allows for the repercussion of the oil price on the Canadian Dollar's exchange rate.
What about taxes?
An important component of the price that you pay at the pump are various types of taxes. In Vancouver, there are three major tax components:
- First, there is a 10 cents per liter federal excise tax.
- On top of that are provincial and local excise taxes. In British Columbia, there is a 25.5 cents per liter tax on the South Coast (Lower Mainland of BC), which is lower in the Capital Region (around Victoria) and the rest of BC. The carbon tax at $30 per tonne of carbon dioxide adds another 6.67 cents per liter. The grand total is 32.17 cents per liter of provincial excise taxes in Vancouver.
- Lastly, 5% GST is payable on top of the cost and excise taxes.
You can find some of these numbers in my recent paper with Sumeet Gulati, Reducing the Environmental Impact of Transportation - British Columbia's Tax Policy Initiatives in the Canadian Tax Journal 60(4) from December 2012. If you start out with a cost basis of 85 cents per liter, add 42.17 cents per litre excise taxes, and another 5% of GST, you get a retail price of 133.5 cents per litre.
The chart below shows the amount of taxes embedded in gasoline prices in Vancouver. In 2000, gasoline prices included about 30 cents in taxes. Increases in excise taxes and the introduction of the carbon tax have brought that amount to nearly 50 cents in 2014.
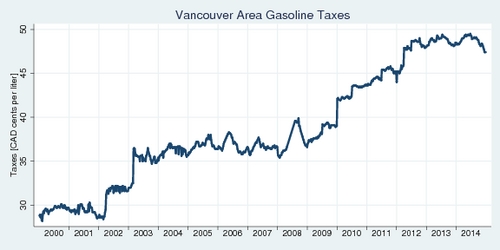
Click on the image to enlarge and view as a printable PDF file.
Another way of looking at the amount of taxes is as a percentage share of the total price you pay. Even though gasoline taxes have gone up markedly over the years, their share has staid flat, and perhaps has even decreased a little. In 2000, gasoline taxes amounted to about half of the total price, while in 2013 it came to just about one-third. Due to the recent drop in crude oil prices, the share of taxes is increasing a bit again but still is less than 50%.
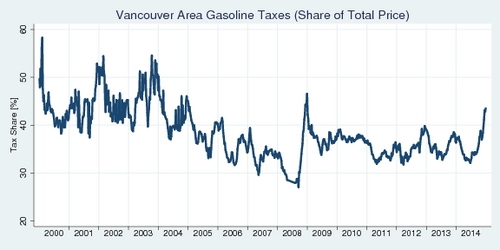
Click on the image to enlarge and view as a printable PDF file.
As a motorist, are you feeling a little overtaxed in Vancouver? Perhaps you shouldn't. The US Energy Information Administration publishes a weekly international comparison of gasoline prices from major industrialized countries. The prices are in US dollars per gallon including taxes. To express them in US cents per litre, multiply by 26.42. Multiply by 1.18 to get prices in Canadian cents per litre (at a USD/CAD exchange rate of 0.847). For the week of January 5, 2015, the average German paid US $6.00 per gallon, or 187 cents per litre. In Italy, the price was 212 cents per litre. By comparison, the average US consumer paid only US$ 2.60 per gallon, or 81 cents per litre. It is certainly true that Vancouverites pay about 20 cents more per litre than their US neighbours in Blaine or Bellingham, but this a far cry from the tax burden imposed on the average European. They can manage to live with these taxes, and these taxes have done much good to improve fuel efficiency and promote automotive innovation. The United States could easily fix their fiscal deficit by raising gasoline prices gently over time. It is quite apparent that the current Republican-led US congress lacks the courage to touch this politically unpopular policy, but it would do the US much good if they did. Fuel in the US remains heavily undertaxed.
What about price dynamics?
The discussion above is all about long-term relationships between crude prices and retail prices of gasoline. There is no indication of how price dynamics play out. What happens when crude prices rise and fall: do gasoline prices at the pump respond instantly or only with delay, and do they respond equally fast in both directions? The answers to these questions play out in an important part of the industrial organization literature: the rockets-and-feathers hypothesis (RFH). I will examine this question in my next blog. Stay tuned.