click on image for high-resolution PDF version
The year 2015 marked a huge decrease in the value of the Canadian Dollar against the US Dollar. At the beginning of the new year 2016, the Canadian Dollar is flirting with 70-cent US territory, as low as it has not been in over a decade and a huge decline since the beginning of 2013, when the Canadian Dollar traded at parity with the U.S. Dollar (see chart above). In my blog The Canadian Petrodollar I discussed the prime reason for this: the link between commodity prices (dominated by crude oil) and the exchange rate. Cross-border shoppers despair when they see that the loonie does not have the purchasing power it used to just a year or two ago. But was 2015 indeed one of the extreme years for the Canadian Dollar? I have compiled a top-ten list of how the Canadian Dollar has fared in every year since 1973, when the Bretton Woods system gave way to floating exchange rates.
The metrics I use are very simple. I tally the changes in daily exchange rates over the course of one year \(y\). To preserve symmetry, changes are difference in the logarithms of the exchange rates. The exchange rate itself (\(X_t\)) is expressed in volume notation (USD per 1 CAD). Then: \[ \Delta x_t=\ln(X_t)-\ln(X_{t-1}) \] To obtain an annual measure, simply add up the daily changes over the course of the entire year: \[ C_y = 100\cdot\sum_{t\in y} \Delta x_t \] For volatility, take the absolute value of the changes and sum these over one years. \[ V_y = 100\cdot\sum_{t\in y} |\Delta x_t| \] Both measures are multiplied by 100 to make them more readable. Call them "log points", or points for short. So what do we find? The table below show the top ten years in terms of exchange rate appreciation, exchange rate depreciation, and exchange rate volatility
| Rank | Appreciation | Depreciation | Volatility | |||
|---|---|---|---|---|---|---|
| Year | Points | Year | Points | Year | Points | |
| 1. | 2003 | 20.07 | 2008 | 21.46 | 2008 | 179.2 |
| 2. | 2007 | 16.49 | 2015 | 17.65 | 2009 | 176.3 |
| 3. | 2009 | 15.71 | 1992 | 9.53 | 2010 | 131.0 |
| 4. | 1988 | 8.63 | 2014 | 8.68 | 2004 | 117.6 |
| 5. | 2004 | 7.12 | 1977 | 8.10 | 2011 | 114.5 |
| 6. | 1987 | 6.03 | 1978 | 8.08 | 2003 | 113.0 |
| 7. | 1999 | 5.87 | 1998 | 6.85 | 2015 | 112.8 |
| 8. | 2010 | 5.10 | 2013 | 6.68 | 2007 | 103.6 |
| 9. | 2005 | 3.18 | 1984 | 6.01 | 2005 | 99.8 |
| 10. | 1989 | 2.96 | 2001 | 5.98 | 2006 | 86.0 |
The year 2015 wins second prize for the years with the biggest drop. It fell nearly 18 points, only topped by 2008—the year of the global financial crisis—when it fell by over 21 points. The year 2014 ranks fourth, and 2013 eighth. In terms of volatility, the year 2015 ranked seventh, while the fourth-year period 2008-2011 takes four of the top five spots. The years of the financial crisis and its aftermath generated huge currency volatility.
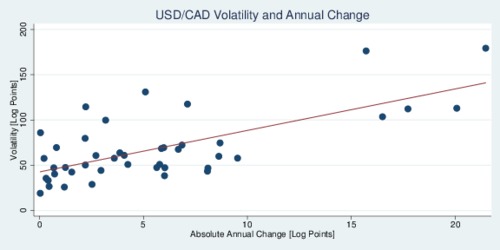
This ranking points to an important issue in exchange rate economics: large changes in exchange rates coincide with more volatility. Volatility means uncertainty for businesses, and thus large changes not only affect the bottomline of businesses, but also make planning harder as the exchange rate bounces around more. The graph below shows this effect. The horizontal axis shows the total absolute change from year to year \(|C_y|\), and the vertical axis shows the volatility measure \(V_y\). There is quite apparently a strong correlation: larger changes coincide with larger volatility.