Mobility pricing can help reduce congestion and pollution. But how exactly does it work? A little bit of transportation economics, illustrated in the diagram below, helps explain the logic. The starting point is the insight that there is a gap between the private and social cost of driving. A motorist only incurs the private cost (time, fuel). However, driving also generates negative side effects (pollution, congestion). Adding these externalities to the private cost sums up to the full social cost.
click on image for high-resolution PDF version
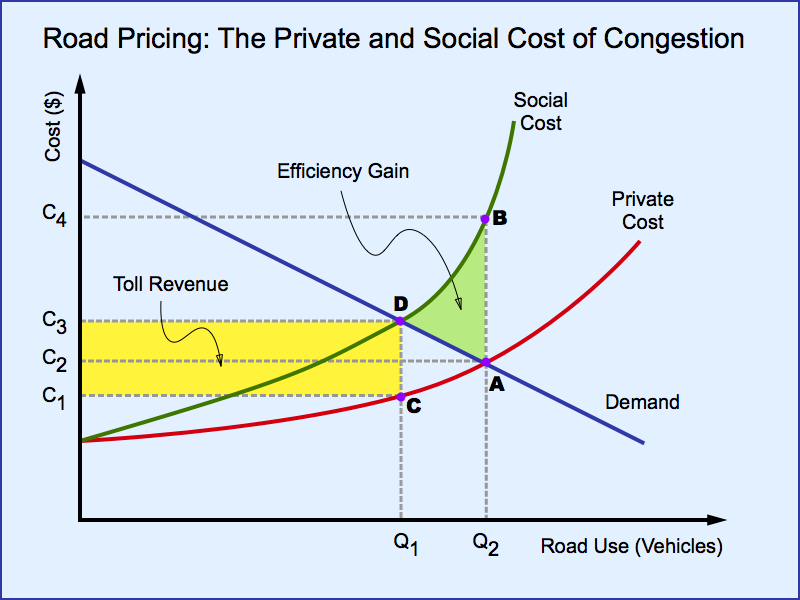
The diagram shows supply and demand for road use. Demand is downward sloping: the higher the cost of driving, the less people drive. Supply is upward sloping. As more drivers use the roads, congestion adds more and more time to each journey, driving up the cost. The social cost goes up along with it, although this cost is incurred by other drivers and society at large. In equilibrium without mobility pricing (point A), supply meets demand as Q2 vehicles incur cost C2. With road use Q2, the full social cost is in point B at cost C4, much higher than the private cost C2.
How can road pricing improve on this situation? We can set a road toll that bridges the gap between private and social cost. In other words, motorists will now pay the full cost of road use rather than just their private cost. Specifically, introduce a toll at a rate of C3-C1. This actually reduces their private cost, as they drive less and traffic volume decreases from Q2 to Q1. At point C the motorists incur a private cost of C1 and a social cost of C3. As their "effective" supply is equal to the social cost, the equilibrium is determined by the intersection of the demand curve and the social supply curve in point D.
The cost to drivers has increased from C2 to C3, although this remains somewhat less than the amount of the toll (C3-C1) because of the reduced private cost. The total amount collected from the toll is (C3-C1) times Q1, the rectangle shaded yellow.
Society has gained as the gap between social and private costs (the difference between points A and B) has been eliminated as we arrive at point D. The total gain is the green-shaded area above the demand curve and below the social cost curve.
The optimal toll is determined uniquely as there is only one point D where the social cost curve meets the demand curve. The optimal toll is determined by moving downwards until we reach point C. But what should be done with the toll revenue? One option is to use the toll revenue as general government revenue. Another possibility is to invest it in alternative modes of transportation, in particular public transit. A third alternative is to give the money back to drivers, without affecting their driving decisions. For example, it could be used as rebates to drivers who buy more fuel-efficient cars.
Road tolling necessarily creates winners and losers. As road use declines from Q2 to Q1, these trips are either lost or need to be replaced by alternative forms of transportation. These drivers are worse off because the alternative mode may be slower than taking the car. Those who pay the toll get compensated by faster roads. Addressing these issues about fairness remain the most challenging problem to solve about mobility pricing.
There are three types of road pricing systems that can be used:
- With cordon pricing an entire city area such as a downtown core is tolled at all access points. This is also known as ring tolling, and is used in London (UK) for example.
- Another way to toll involves corridor pricing where tolls are set for using specific roads, bridges, or tunnels. Examples include Highway 407 in Toronto and the Port Mann and Golden Ears bridges in Metro Vancouver.
- Another tolling system involves network pricing where the entire transportation network is priced, typically based on vehicle kilometres travelled. Some European countries use sych systems for heavy-goods vehicles.
Which system works best depends on the purpose. In addition to managing demand, another important function of tolling is to reallocate traffic in an optimal fashion. Certain parts of the transportation network need different prices to get the desired result.
This blog owes gratitude to my Sauder School of Business colleague Robin Lindsey, who has worked extensively on transportation economics and mobility pricing issues. See for example his C.D. Howe Institute Commentary Congestion Relief: Assessing the Case for Road Tolls in Canada, May 2007. The diagram in this blog is adapted from an illustration in his work. See also Robin's op-ed A way ot of the morass: Mobility pricing needs a leader that appeared on August 6, 2014 in the Winning Free Press.
This blog is the fourth in a series. Topics covered previously include: Traffic congestion in Canada (Jan. 28); Haphazard road tolling (Feb. 11); and Public Transit and Road Pricing (Feb. 28). Some of these are more technical in nature.