Canada's electricity generation landscape is changing. In this blog I present two charts that make this point rather convincingly. The first chart shows per-capita electricity demand in capita, and the second chart shows the composition of electricity generation.
click on image for high-resolution PDF version
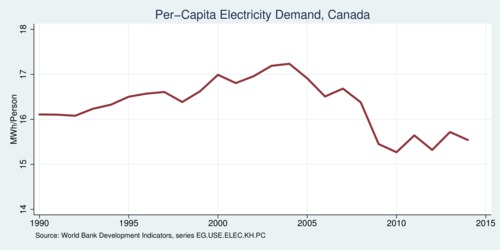
Per-capita electricity demand has actually leveled off a little in recent years, and in particular after the economic recession in 2008. The changes are not huge, but in 2015 per-capita electricity consumption is actually below the level it was in 1990. In part this is due to improved energy efficiency, such as switching to LED lighting. Another part is due to changes in industrial activity: composition (which industries), scale (size of industries), and technique (energy use per dollar of output). Canada's per-capita electricity is much higher than in many other countries, including the United States. This does not mean that Canada is profligate. Instead, Canadian use relatively cheap hydro-power to heat their homes much more than in other countries where electricity is both more expensive and less clean. For households there has not been much of a switch in the composition of energy use. Electricity use has not declined much; the share of natural gas has increased, while the share of heating oil has declined. Energy efficiency in the residential sector is improving, according to research conducted by Natural Resources Canada. Residential use of electricity for space heating amounts to about a quarter, while about half of heating demand is covered by natural gas. Electricity also provides a quarter of residential water heating needs, while more than two-thirds are covered by natural gas.
When analyzing the overall change in energy and electricity use in the industrial sector, it is useful to decompose this change into several components:
- scale effect: changes in energy use to increased or decreased level of economic activity;
- composition effect: changes in energy use due to shifts in the composition of economic activity, especially from energy-intensive to non-intensive sectors of the economy;
- technique effect: improvements in energy efficiency.
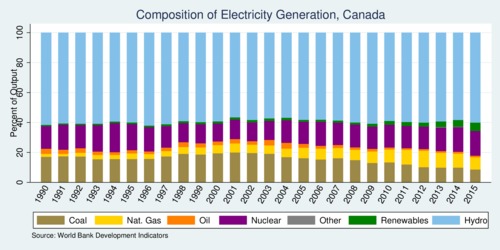
The second chart decomposes electricity generation in Canada by fuel type between 1990 and 2015. Overall, hydroelectricity continues to provide roughly 60% of Canada's electricity demand. British Columbia, Quebec, Manitoba, and Newfoundland and Labrador all produce more than 85-95% of their electricity from hydro. Canada is also a net exporter of electricity. Roughly a tenth of output is transmitted to our southern neighbours. The share of nuclear power has held relatively steady over the last decades. However, there are three major trends.
click on image for high-resolution PDF version
(1.) Since the early 2000's, the share of coal is rapidly declining as Ontario has been phasing out its coal plants. Coal power plants account for a sizable share of generation capacity only in three provinces: Alberta, Saskatchewan, and Nova Scotia. (2.) Most of the decline in coal is compensated by an increase in natural gas, which produces fewer emissions than coal, and has been boosted by low prices due to the fracking revolution. (3.) Renewable energies, mostly wind, are making inroads but starting from a low level. Overall, the phasing out of coal will continue.
Environmentally, phasing out coal is a major gain. It reduces Canada's carbon emissions, but also emissions of sulfur dioxide and nitrogen oxides. Many of the coal plants that have already been shut down were old and particularly strong emitters. Many of the remaining plants are of a newer and more efficient generation. Electricity generation accounts for only a small share of total nitrogen oxides emissions in Canada, but for a sizable share of sulfur dioxide emissions in Canada. While total nitrogen oxides emissions have decreased somewhat, sulfur dioxide emissions in Canada have decreased by 66% between 1990 and 2015. Retiring coal plants has contributed much to this decline in sulfur dioxide emissions.
The dominance of hydro-power in Canada is likely to continue, as new major projects near completion or are under construction: Muskrat Falls in Labrador [824 MW], Keeyask Generating Station in Manitoba [695 MW], and Site C dam in British Columbia [1,100 MW]. However, wind power is expanding rapidly, with Ontario, Quebec, and Alberta accounting for most of the installed capacity.
Further readings:
- Natural Resources Canada: Energy Fact Book 2016-2017.