Road safety concerns us all. It has been estimated that about 1.35 million people die every year in the world's roads. In Canada, there are about 5.8 road traffic deaths per 100,000 people every year (according to WHO data). While Canada's record is much better than in the United States (12.4), which has one of the worst records among OECD countries, Canada's record is still double that of Sweden (2.8).
If you look around your neighbourhood, it is not difficult to find horrific examples of road fatalities. I had just attended a meeting at UBC on road safety on the morning of September 11, when shortly afterwards I heard news of a fatal accident right at UBC. While no official report has been released yet, I am very familiar with the road as it leads into UBC. The speed limit on 16th Avenue is 50 km/h, and the westbound two-lane road narrows to a single lane, continues past a crosswalk, and approaches the roundabout at Wesbrook Mall. Vehicles notoriously exceed the speed limit on this stretch of road, and it is easy to imagine that speed may have been a factor in the cause and/or severity of the accident. We cannot simply shrug our shoulders, think "I am glad it wasn't me", and move on. We need better road safety policies. Motorists also need to change their cavalier attitudes towards risky driving behaviour and speeding; they remain a significant part of the problem. Even the best of laws do not accomplish much without adequate law enforcement. Municipalities are increasingly aware that more can be done than in the past.
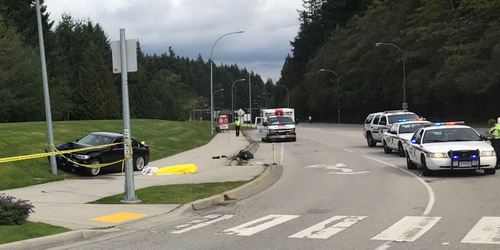
One person died in this car crash at UBC's 16th Avenue on westbound
approach to Wesbrook Mall, September 11, 2019. Source: News 1130.
‘Vision Zero boldly envisions a world without road fatalities.’
Vision Zero is a road safety strategy that refuses to accept that fatalities and serious injuries are inevitable consequences of motor vehicle use worldwide. Ask yourself the question: how many deaths are acceptable for our road use every year in Canada? One hundred? One thousand? According to Transportation Canada Statistics, the actual number in 2018 was 1,841. Now ask yourself the question: how many deaths of your family members—your spouse, your children, your parents, and your grandparents—is acceptable? I bet your answer is the same as mine: zero. Quite frankly, zero is the only acceptable number of deaths within our transportation system. The questions is how do we get there? Enter Vision Zero.
Speed is a major factor in the severity of accidents. Even if accidents cannot be avoided entirely, the number of fatalities and the severity of injuries can be reduced significantly. The problem starts with physics. The higher the speed, the longer is the distance to come to a full stop, and this distance rises in a non-linear fashion with speed. Statistical evidence shows that deaths and injury rise rapidly with speeds beyond 30-40 km/h.
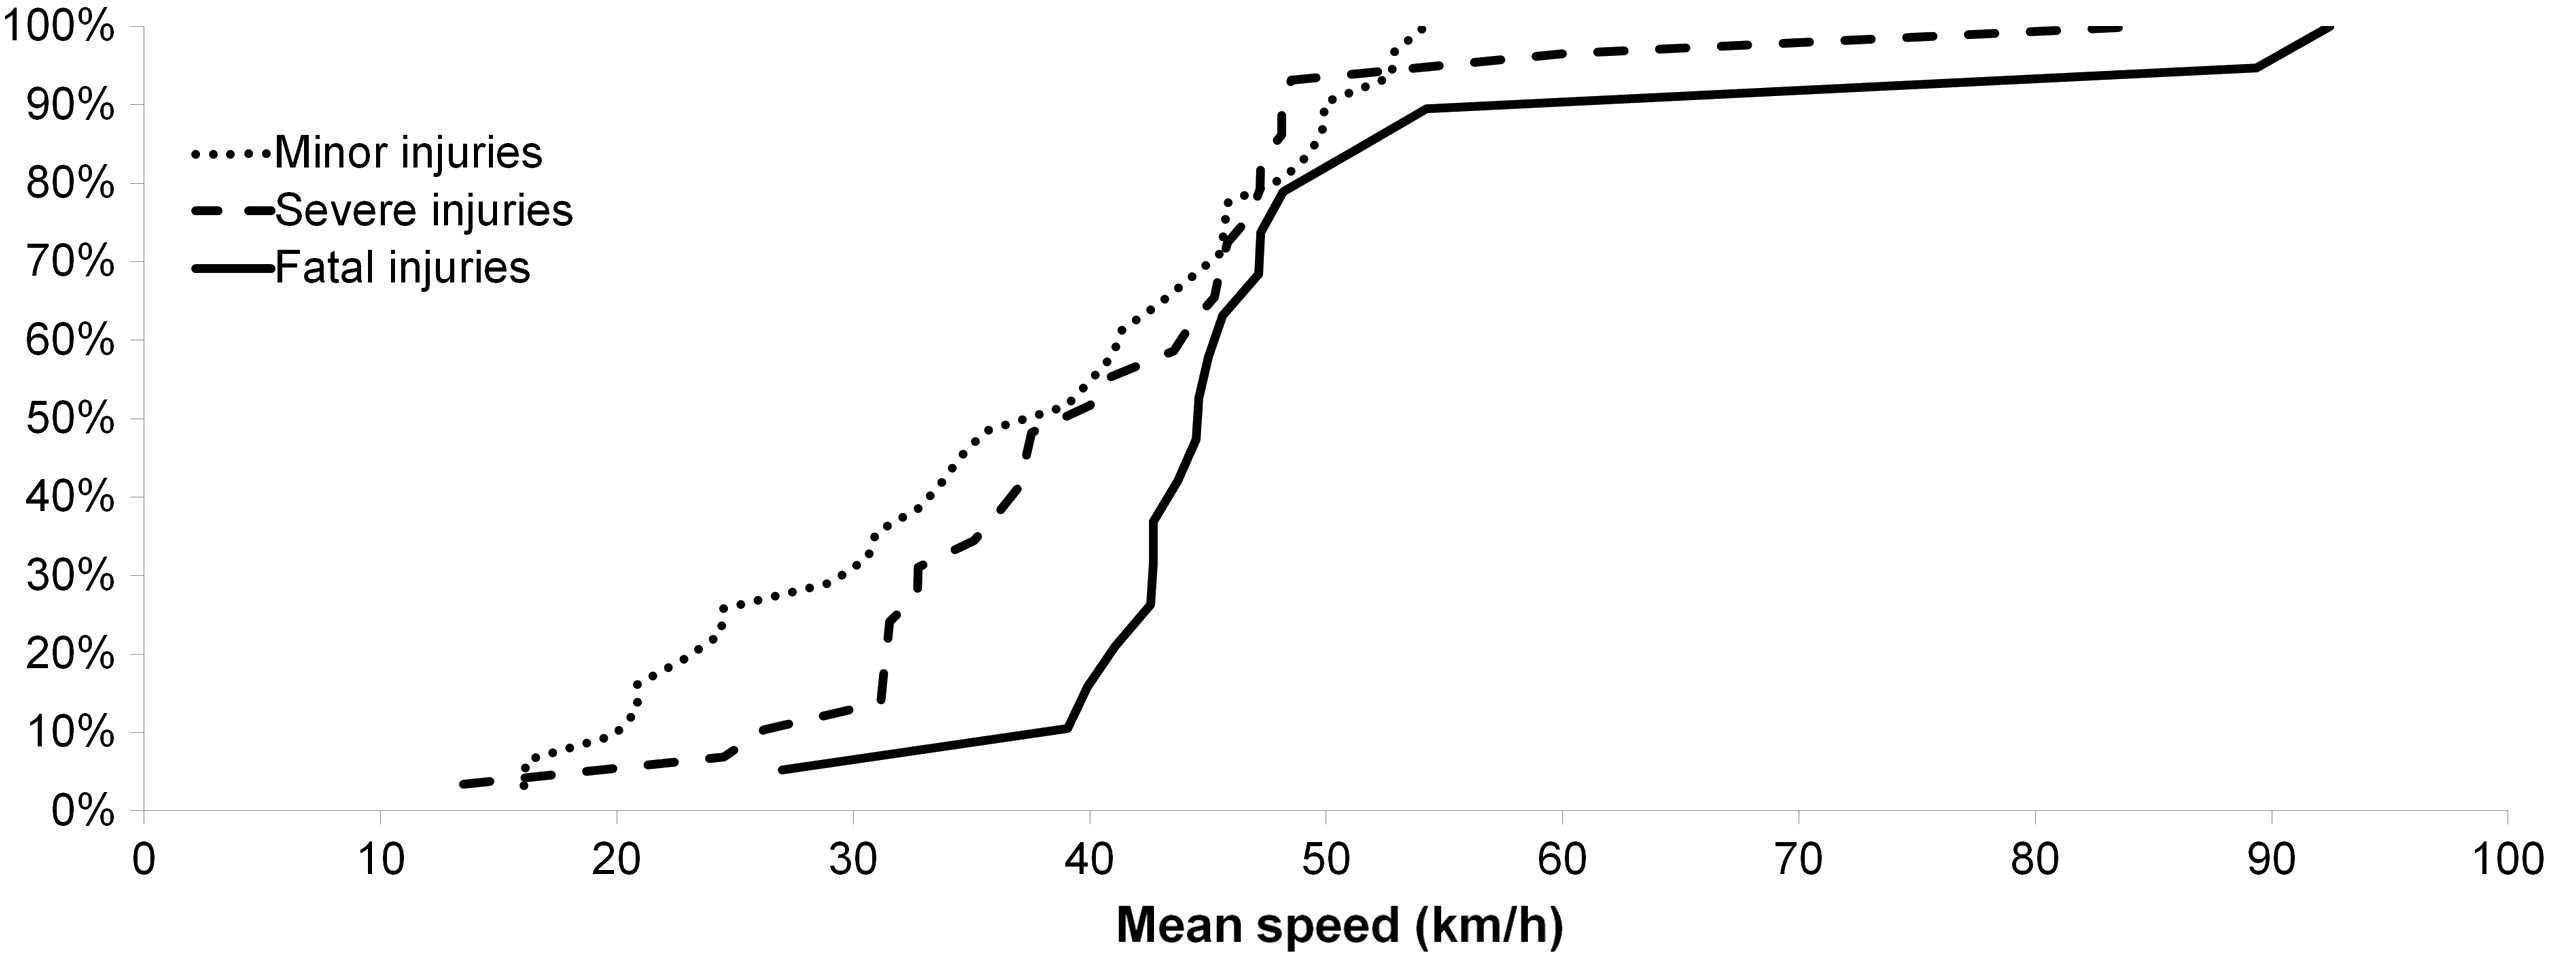
Cumulative distribution of mean speeds at the accident locations by injury severity. Source: Kröyer (2015).
The diagram above shows results from a Swedish study that look at the cumulative number of minor injuries (dotted curve), severe injuries (dashed curve), and fatalities (solid curve). As speed rises, the risk of injury or death rises in a non-linear fashion. Past about 40 km/h, fatality risk rises very steeply. The Swedish study by Kröyer also found that fatal accidents are rare at locations with mean travel speeds below 40 km/h, and that elderly people (75 years and older) are highly over-represented in fatal accidents involving pedestrians.
‘Pedestrian fatality risk rises disproportionately with impact speed.’
The diagram below shows a speed-fatality curve based on a larger German data set, fitted to a logistic curve. The authors of the study, Rosén and Sander (2009), found that the fatality risk at 50 km/h is more than twice as high as the risk at 40 km/h and more than five times higher than the risk at 30 km/h. It challenges our notion that 50 km/h is the "right" speed limit for urban roads. For roads that have a high potential of interactions with pedestrians and cyclists, the 50 km/h speed limit is simply too high.
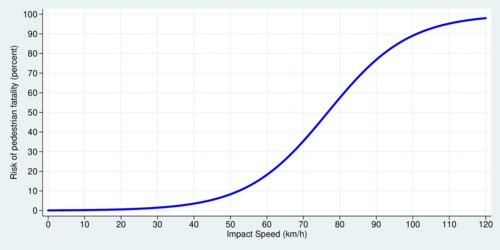
Logistic speed-fatality curve based on Rosén and Sander (2009).
Click on image for high-resolution PDF version.
There is an important difference between the two graphs. The lower graph shows the estimated individual fatality risk based on the impact speed. The upper graph shows the cumulative risk, which weights the individual risk with the frequency of the impact speeds observed in practice. According to Rosén and Sander, approximately half of all pedestrian fatalities had exposure to an impact speed between 50 km/h and 80 km/h. Also, it is important to keep in mind that impact speeds are lower than driving speeds because in many accidents the driver was able to slow down the vehicle before impact.
Work by Anderson et al. (1997) found higher risks than reported by Rosén and Sander (2009): namely that fatality risk at impact speeds 50 km/h is about 85%. For the empirically-minded reader, there are reporting biases in traffic accident reports, and some studies are based on small numbers. By comparison, the Rosén and Sander analysis included some 2,127 incidents over a nine year period. Statistical challenges also come from other sources, such as accurately determining the speed of the impact. The results by Rosén and Sander (2009) are at the lower end of fatality risk that is often reported in the literature. The authors attribute the difference primarily to sampling bias towards severe injury accidents in previous studies. Some accidents may involve pedestrians who remain unharmed due to the response of the motorist. However, the effect of higher speeds remains highly non-linear regardless of the sampling approach. Even if the total risk is lower than reported in earlier studies, lowering speed will lead to large reductions in fatalities and severe injuries. This response is a function of relative risk, not absolute risk.
The cavalier attitudes towards speeding that many motorists exhibit is a significant problem. Stephens et al. (2017) found that a large proportion of drivers sampled in their Australian study self-reported driving above the posted speed limit in the course of normal driving, with the level of non-compliance increasing in accordance with the speed zone. Importantly, non-compliance rates were higher for males and younger drivers. This observation implies that targeting those driver groups that are responsible for a disproportionate number of accidents is critically important.
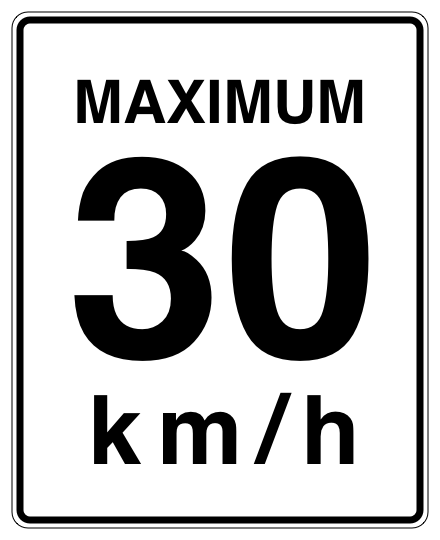
In British Columbia, the City of Surrey adopted Vision Zero, and its plan is targeting the top 50 high collision intersections with road safety infrastructure. The City of Vancouver strives for zero fatalities in its Moving Towards Zero Safety Action Plan. Recently, city council moved to consider 30 km/h speed limit for local streets, as the Vancouver Sun reported on April 19, 2019. In 2016, a report from BC's Provincial Health Officer stated that "speed limits of 30 km/hr would be safest for local neighbourhood roads and other mixed use roads where vulnerable road users are not protected via infrastructure." Toronto's Vision Zero 2.0 calls for speed limit reductions from 60 to 50 km/h on numerous roads, albeit no reductions to 30 km/h are envisioned at this point.
Sweden is ahead of Canada when it comes to adopting speed restrictions on residential roads. Stockholm adopted 30 km/h on all residential streets already in 2004. Many cities around the world have emulated the Swedish model and have adopted 30 km/h on residential streets since. In Canada, Montreal will reduce speed limits to make streets safer for pedestrians, targeting 40 km/h for main streets and 30 km/h for residential streets.
Some of my economist colleagues may find fault with "Vision Zero" because it targets something that seems impossible to attain and because it contradicts the conventional logic that the marginal benefits of public policies should equal their marginal costs, which implies that the number of road fatalities is some number larger than zero. At what point does the cost of preventing a further road death exceed the value of a statistical life (VSL)? After all, VSL is not infinite. But this argument misses a crucial point: while we may never reach absolute zero, we can get a whole lot closer to zero than today. Economic tools can be enormously helpful in getting us to this goal. Cost-benefit analysis (CBA) is an integral element of designing smart road safety policies: we should pursue all public policies that generate a net social benefit—and there is every indication that there are numerous road safety measures that meet this criterion. Economists can help prioritize the policies that are most cost-effective at reducing road deaths. The SafetyNet (2009) report produced for the European Commission highlights many applications of such economic tools. The point is that we need to look broadly at all available options: traffic laws, enforcement, road design and engineering, vehicle technology, and more. Then, CBA helps us figure out which are most effective.
‘Canada should follow the E.U. and require Intelligent Speed Assistance on all new cars by 2022.’
While lowering speed limits is a key element for improving road safety, speed limits alone will not suffice to change motorists' behaviour. Enforcement is needed to make this a credible policy (see also my blogs about speed-on-green cameras" and on average speed section control). A further option is to introduce Intelligent Speed Assistance (ISA) into cars to advise drivers when they exceed the speed limit. The European Transportation Safety Council describes ISA as follows: 1. the car receives position information via GPS and current speed limit from a digital map (or combined with video camera sign recognition); 2. the speed limit is display on the dashboard; 3. the car helps driver to not speed when the speed limit is reached through an audible signal; 4. the driver can override the ISA system to avoid danger by pushing harder on the accelerator. ISA is probably the single most effective new vehicle safety technology currently available in terms of its life-saving potential. ISA is already making its way into many cars manufactured for the European market. as the European Commission has adopted a policy to require ISA in all new models introduced after May 2022. Toronto's Vision Zero 2.0 policy calls on the Ministry of Transportation of Ontario and Transport Canada to explore making ISA mandatory on new vehicles. Canada's Minister of Transport, responsible for transportation safety, should pay attention. Canada's auto industry usually moves in tandem with its US counterpart when it comes to vehicle standards, but the safety of Canadians should not be held hostage to commercial interests and the anti-regulation ideology of the current US administration. If the EU's automobile manufacturers can install ISA in their cars, surely North American manufactures can do so too. Research by Lai et al. (2012) suggests that ISA has a healthy benefit-cost ratio between 3.4 and 7.4 and could reduce accidents on urban roads by a third.
Momentum is building for cities to embrace Vision Zero wholeheartedly. Every road death is one death too many. Some will object to lower speeds and more enforcement. Some will complain that it will make their commutes longer. However, average commuting speeds are actually well below 50 km/h already. Lower speed limits will actually not slow down traffic noticeably as a result. Economic analysis (using CBA) will take mobility costs into consideration when choosing among different options. The cities that have already adopted 30 km/h speed limits demonstrate that commuting times have not increased. Other motorists don't like enforcement, as if sticking to our road laws was somehow optional and getting fined for breaking the law is morally wrong or a "money grab". To counter such notions, more education is needed, and money raised through enforcement should be dedicated to further improving road safety.
Available empirical evidence points to clear net social benefits from numerous road safety measures. It is time to explore each one of them.
Further readings and sources:
- Hörskuldur R.G. Kröyer: Is 30 km/h a 'safe' speed? Injury severity of pedestrians struck by a vehicle and the relation to travel speed and age, IATSS Research 39(1), July 2015, pp. 42-50.
- Brian C. Tefft: Impact speed and a pedestrian's risk of severe injury or death, Accident Analysis & Prevention 50, January 2013, pp. 871-878.
- D.C. Richards: Relationship between Speed and Risk of Fatal Injury: Pedestrians and Car Occupants, UK Department of Transport, London, September 2010.
- Erik Rosén and Ulrich Sander: Pedestrian fatality risk as a function of car impact speed. Accident Analysis and Prevention 41(3), May 2009, pp. 536-542.
- Speed and Crash Risk, International Traffic Safety Data and Analysis Group, OECD Research Report, 2018.
- Where the Rubber Meets the Road: Reducing the Impact of Motor Vehicle Crashes on Health and Well-being in BC, Provincial Health Officer's Annual Report, March 2016.
- Adrienne Tanner: Proposed 30 km/h speed limit in Vancouver is a good idea, but may not go far enough, The Globe and Mail, April 26, 2019.
- Towards Zero: Ambitious Road Safety Targets and the Safe System Approach, OECD and International Transport Forum, 2008.
- Frank Lai, Oliver Casten, and Fergus Tate: How much benefit does Intelligent Speed Adaptation deliver: An analysis of its potential contribution to safety and environment, Accident Analysis & Prevention 48, September 2017, pp. 63-72.
- Ben Welle, Wei Li, Claudia Adriazola-Steil, Robin King, Marta Obelheiro, Claudio Sarmiento and Qingnan Liu: Cities Safer By Design: Guidance and Examples to Promote Traffic Safety through Urban and Street Design, World Resources Institute, July 2015.