British Columbians voted on Saturday October 24 to elect a new Legislature. Because of the pandemic, a large share of ballots were cast by mail. In the end, Elections BC counted 672,633 mail-in votes, which is 35.7% of the 1.89 million votes cast. Did the pandemic conditions bias who mailed in votes, and was that related to political preferences?
It is interesting to draw a comparison to the United States. For their election on November 3rd there were strong indications that returning mail-in ballots favoured Democrats, whereas election-night vote favoured Republicans. The results that trickled in over the following days revealed that this prediction was accurate. Election night leads changed dramatically as more absentee ballots were counted. In British Columbia the process took a bit longer because votes were counted only after two weeks had elapsed.
The results of BC's final count are in and I have taken this opportunity to look back at my predictions of the mail-in vote bias. I had argued that BC's mail-in vote is unlikely to hold any surprises. My prediction was mostly right. I predicted a slight gain for the NDP because BC Liberal leads in two ridings were rather thin (about 1% each). However, I did not predict that the Green Party would lose its lead in the West Vancouver-Sea to Sky riding, which at 3.4% was actually quite sizeable. This flip came indeed as a surprise. Ultimately, as a result of the mail-in votes fully counted, the NDP gained two seats (Vernon-Monashee and Abbotsford-Mission) for a total of 57 seats. However, the Green lead of 3.40% in the West Vancouver-Sea to Sky riding melted away into a 0.17% loss. Thus the BC Liberals picked up one seat. Because the difference in this riding is only 41 votes, a judicial recount is currently under way in this riding.
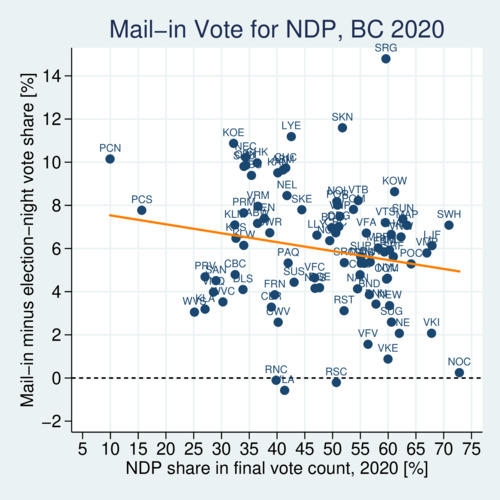
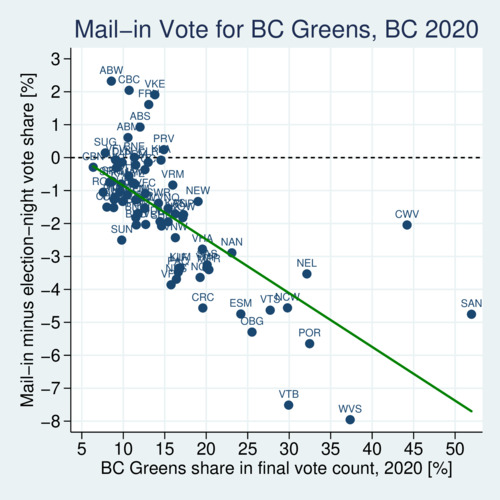
Below I present three scatter plots for each of the three major parties that reveal the relationship between the mail-in vote bias and each party's share in the total vote. The mail-in vote bias is calculated as the share of party's vote in the mail-in ballots minus the share of the party's vote in the election-night ballots. A positive number indicates that the party got a boost from the mail-in vote.
As I had predicted, the BC NDP received a lift from the mail-in vote, which turned out to be about 6 percentage points (pp) on average. The BC Liberals suffered a -2.7pp loss on average, also consistent with my predictions. However, my predictions went wrong for the BC Greens, which actually suffered an average -1.5pp loss rather than the predicted boost.
click on image for high-resolution PDF version
A list of constituency codes is shown at the end of this blog.
The regression line for the NDP chart above reveals that the mail-in gain was slightly larger in ridings where the NDP is weak and slightly stronger in ridings where the NDP is strong. The one riding that stands out is Surrey-Green Timber (SRG), where the mail-in vote had a 14% bias for the NDP candidate, which lifted Rachna Singh's vote share from 55.6% to 59.6%.

click on image for high-resolution PDF version
A list of constituency codes is shown at the end of this blog.
As the above diagram shows, there is also a negative slope of the regression line for the BC Liberals. However, because there average is in negative territory already, the mail-in vote hurt the BC Liberals most in the ridings in which they are strong, notably in Kootenay East.
click on image for high-resolution PDF version
A list of constituency codes is shown at the end of this blog.
The strongest negative correlation between party strength and mail-in vote bias was observed for the BC Green Party. They lost their election night lead in all of their three strongholds: Saanich North and the Islands (SAN), Cowichan Valley (CWV), and most notably in West Vancouver-Sea to Sky (WVS), where they lost their lead and thus the seat. My prediction two weeks ago suggested a positive correlation between the BC Green Party vote share in 2017 and the overall mail-in vote share in 2020. However, this apparently did not translate into overall vote gains, and mostly losses. In this sense, the general trend for the BC Greens mirrors that of the BC Liberals: where they are strong they suffered larger losses from mail-in votes.
I have also looked at the combination of a party's vote share and the overall share of mail-in vote as joint predictors of the mail-in vote bias. It turns out that the mail-in share in each riding is indeed a statistically significant predictor for all three parties. When controlling for both final vote share and mail-in vote share, the party's final vote share actually becomes statistically insignificant for the BC Liberals and the NDP. For the NDP, higher mail-in share is associated with a less favourable positive mail-in bias, while for the BC Liberals, a higher mail-in share is associated with a more favourable mail-in bias (i.e., a reduced negative bias). Only for the BC Green Party both variables are highly statistically significant. Their mail-in bias became more negative with both party strength and mail-in share. Indeed, the combination of low mail-in share and party strength was most pronounced in West Vancouver-Sea to Sky, where their strong lead melted away in the final count.
The takeaway from this discussion is that mail-in votes exhibit political party bias. In 2020, NDP voters had a higher tendency of voting by mail than BC Green and BC Liberal voters. Of course, this could reflect correlations with pandemic conditions and may not be a good predictor of political party biases in future mail-in votes. Perhaps larger shares of mail-in votes are here to stay, even after the pandemic has been brought under control. Mail-in votes are more convenient for many of us. Why travel to a polling station and wait in line when you can mail your ballot from the comfort of your home?
* * *
Below is a list of the 87 three-letter constituency codes that are used in the diagrams above.