Disinformation is a disservice to informed political discourse. When it comes to climate change, it is important to get the facts right. The Canadian Energy Centre, a controversial entity set up by Alberta's conservative government to promote its energy industry, put out a number of statements about the greenhouse gas (GHG) footprint of the oil sands in their article A Matter of Fact that are misleading and plain wrong. My colleague Andrew Leach wrote about it in his blog Facts matter shortly aftewards. I want to take the opportunity to concur with my colleague and state the facts in a number of diagrams.
The Canadian Energy Centre claims that "the carbon footprint of Canada's crude oil is steadily decreasing." This statement is verifiably false. Look at the next chart of all emissions of Alberta's oil and gas industry as recorded by Canada's official Greenhouse Gas Inventory. The carbon footprint is generally understood to mean total emissions of greenhouuse gases, measured in million metric tonnes [MT] of carbon dioxide (or equivalent for other gases such as methane) per year. The chart below shows the emissions of all sectors of Alberta's oil and gas industry. Emissions overall have risen from 67 MT in 1990 to 139 MT in 1998; this is more than double over this period. Emissions from the oil sands alone have been increasing from 15 MT in 1990 to 81 MT in 2018. That is an increase by a factor of 5.4 over 28 years, a growth rate of 6.2% per year. This increase has not slowed down in recent years.
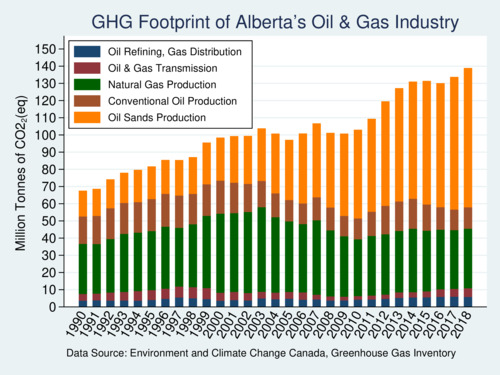
click on image for high-resolution PDF version
The diagram shows that a significant contribution to Alberta's GHG footprint comes from natural gas production (green bars). This part has held steady in recent years and has actually shrunk a little since its peak in 2003. However, emissions from oil sands production have been rising steeply and have been more than offsetting reductions elsewhere. The next chart takes a closer look at the oil sands emissions (orange bars in diagram above).
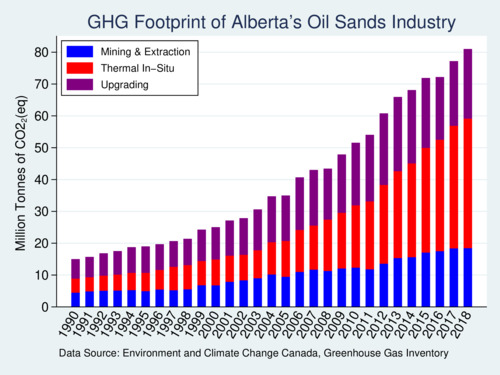
click on image for high-resolution PDF version
Emissions from oil sands production come from three separate sources. First is surface mining (blue bars). Next is thermal in-situ mining (red bars), which works by injecting steam deep into underground deposits and pumping the oil to the surface. Recent expansion of the industry has been relying heavily on this technology. Most of Alberta's bitumen reserves are too deep to be mined and can only be extracted in-situ. Finally, there is upgrading (purple bars). This is a process through which bitumen is transformed into synthetic crude oil, or syncrude for short, using fractionation and chemical treatment. Not all bitumen is upgraded. About two thirds of produced bitumen is diluted with condensate and shipped to refineries directly. The remaining third is upgraded. Most upgraded bitumen is sourced from mined bitumen. So to interpret the above graph, mining and upgrading are closely linked (but not exclusively). Overall, the contribution from thermal in-situ mining has been rising fastest due to the growth of this production technology.
The claims from the Canadian Energy Centre also pointed to the innovation in the industry. That is a half-truth that conveniently omits describing the magnitudes that are involved. Notwithstanding innovation by some producers, the average emission intensity of production technologies has not decreased as dramatically as is suggested. The next diagram combines production data from Alberta's Energy Regulator with emissions data from the GHG Inventory to calculate emission intensities for all three emission streams of the oil sands industry in Alberta. The diagram shows emissions in kilograms of carbon dioxide per cubic metre of crude oil.
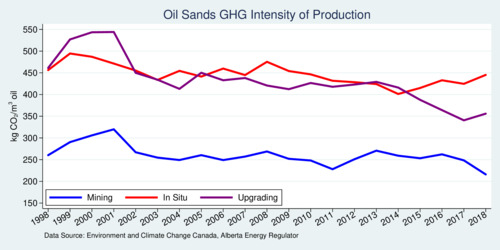
click on image for high-resolution PDF version
The emission intensity of in-situ extraction (red line) has held steady for nearly three decades and shows no sign of decrease. The emission intensity of mining has started to drop a little in the last few years, but given the overall fluctuations in emission intensity over the years this does not yet constitute a significant trend. The emission intensity of upgrading has come down the most in recent years, from about 450 to about 350, or roughly 25%. These are hopeful signs of process improvements, but emissions from upgrading are only a small part of the overall picture.
Shell's Quest Carbon Capture and Storage facility near Edmonton has sequestered five million tonnes of CO2 from its nearby upgrade since it started operating in November 2015. CCS, while still expensive, has contributed to lowering the emission intensity of upgrading.
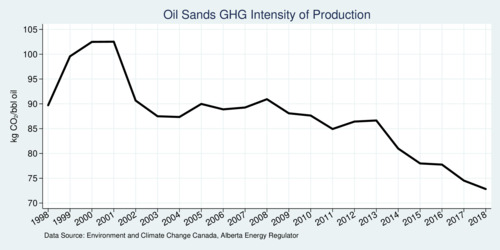
Even the Government of Canada seems a bit challenged disassembling the above numbers. A pullout box on page 54 in the Inventory Report 2020 shows a decline from 119 to 78 kg CO2 per barrel for the emission intensity of the oil sands from 1990 to 2018. (This data is also shown as a chart on the Natural Resources Canada web site.) To good to be true?
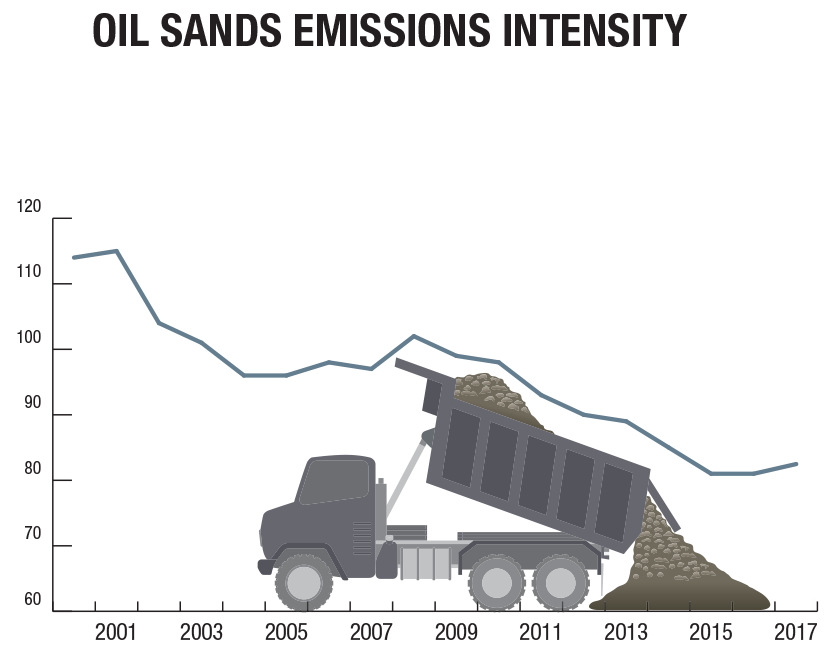
The next diagram shows the total emissions of the oil sands divided by total shipped oil from the oil sands. The AER production data doesn't go back to 1990, but the 1998-2018 data shows a steep decline in 2001 and 2002, and a continuous decline since 2013, that mirrors the data discussed in the Inventory Report. But wait a moment and look at the previous diagram. There was not much of a technique effect except for upgrading. So why does the diagram below show a much more noticeable decline? The answer is found in the composition effect.
click on image for high-resolution PDF version
Recall that there are two types of oil produced from the oil sands: syncrude and diluted bitumen. Diluted bitumen is exported to refineries abroad. So the decrease we see in the above diagram comes from the shift towards shipping more diluted bitumen that follows in the wake of increased in-situ extraction. The result is that emissions are shifted from Canada to (mostly) the United States. What appears as an improvement in emission intensity is more of a composition effect than a technique effect. From a climate change perspective it does not matter where carbon dioxide emission is emitted. Upstream and downstream emissions must be added to get a complete picture of the emissions associated with one barrel of oil coming out of the ground at any given location. Because oil markets separate upstream and downstream emissions across international borders does not mean that oil production has become cleaner. It just means that we count fewer downstream emissions this side of the border.
The bottom line is clear: Alberta's GHG emissions from its oil sands industry have been growing through 2018 (with data for 2019 and 2020 not yet available). The policy conclusion is equally clear: if Alberta's oil sands continue to grow, so will emissions. If Canada wants to meet its national obligations under the Paris Agreement, Alberta's oil sands industry cannot continue to grow. The oil sands industry's 81 MT are 11% of Canada's 729 MT of GHG emissions in 2018, and Alberta's oil & gas industry overall accounts for 19% of Canada's total emissions. When it comes to reducing GHG emissions, Alberta's oil & gas industry will need to carry its fair share of the burden.
Lastly, a few words about Alberta's Canadian Energy Centre. This entity has been described as "Alberta's energy war room". Who exactly are they trying to convince? The war room's director, Tom Olsen, said in a TV interview that "we are not about attacking; we are about disproving true facts." Hilariously and probably unintentionally, he may have summed up the Centre's true mission: disinformation. No amount of taxpayer money wasted on Alberta premier Jason Kenney's "war room" will rescue the Canadian Energy Centre from its utter lack of trustworthiness. If only this taxpayer money was spent on real solutions to climate change rather than hot air.