In my last blog, Where Canada's federal election is competitive, I pointed to the large number of electoral districts that are indeed competitive in most elections. When you look at the opinion polls, polling firms only report percentages of voting intentions across Canada or major regions (Atlantic, Ontario, Quebec, Prairies, Alberta, BC). What is hiding beneath these numbers is the significant heterogeneity in outcomes across electoral districts. Parties do not uniformly gain or lose. There is significant variation across the country. Look at the outcome of the last two federal elections in Canada, 2015 and 2019. The Liberal Party achieved an outright majority in the first election, while losing seats and its majority in the second election.
The three diagrams below show the distribution of gains and losses across each of the 338 electoral districts. The histograms use 5-percent bins. For example, in the first diagram the Liberal Party gained between 0 and 5 percent in fifty ridings. While the Liberal Party overall lost 6.4% of its vote share, in one riding (Sydney–Victoria, Nova Scotia) the party lost 42.3% while in another (Laurier–Sainte-Marie, Quebec) it picked up 18.1%. Similarly, the Conservative Party lost as much as 20% in one riding (Beauce, Quebec) and gained 29.4% in another (Bonavista–Burin–Trinity, Newfoundland). Quite clearly, political fortunes do not swing in the same direction everywhere. Local factors matter and interact with nation-wide trends.
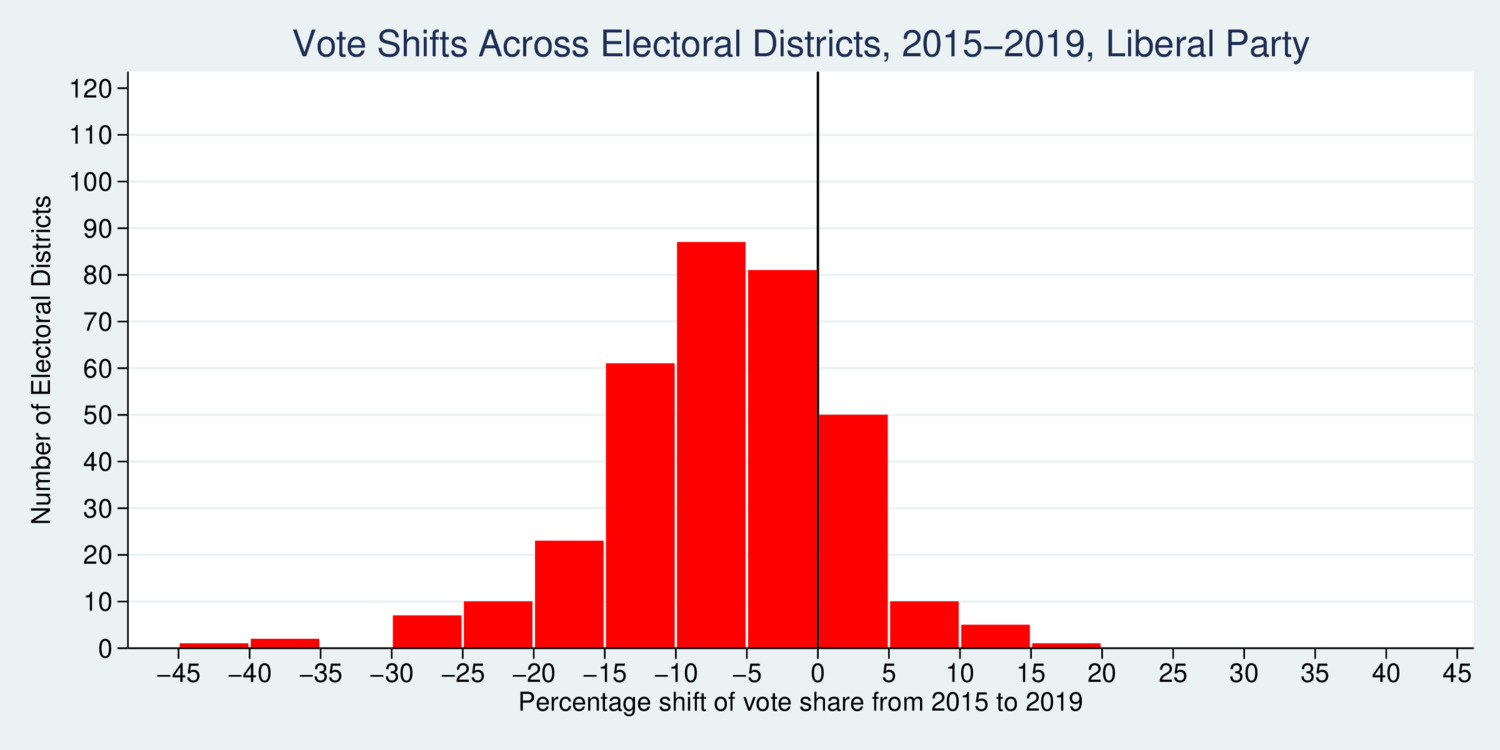
click on image for high-resolution PDF version
The diagram above shows the shift across electoral districts for the Liberal Party, which lost a total of 27 seats in the 2019 election. But even though the party suffered large setbacks across the country, it made noticeable gains in Ontario and Quebec. Ultimately, it is the ridings with the close contests that determine seat gains and seat losses.
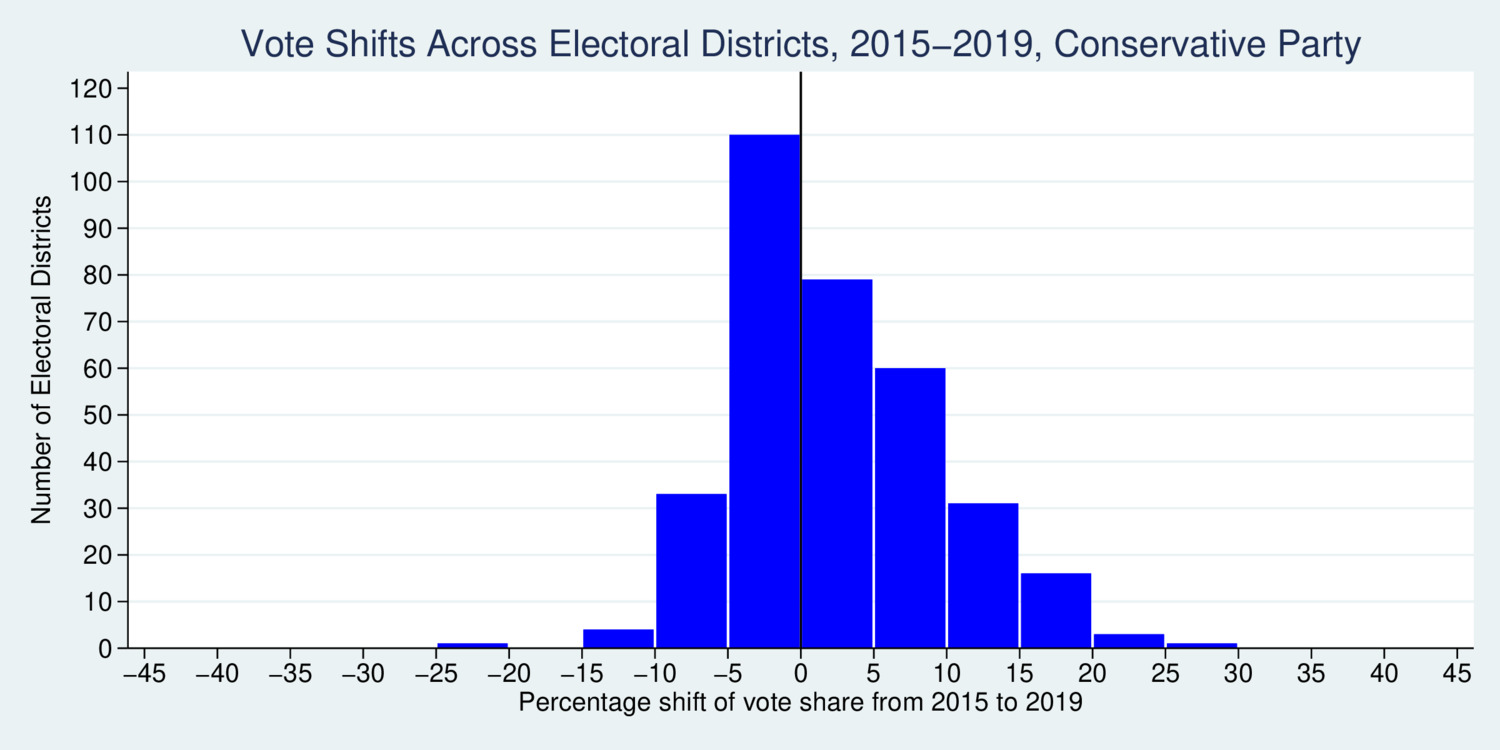
click on image for high-resolution PDF version
The Conservative Party gained votes in the 2019 federal election, but not uniformly. The Party gained votes in 56% of the ridings, but lost votes in 44% of the ridings. What mattered was that on average the party gained votes in a number of closely-contested ridings. The standard deviation of the vote shift is a good indicator for the heterogeneity in vote shift. It turned out to be 8.1, 7.1, and 8.4 percentage-points for the Liberal Party, Conservative Party, and New Democratic Party, respectively. This is a fairly wide band. Canadian voters are perhaps more volatile than the nation-wide vote shares suggest.
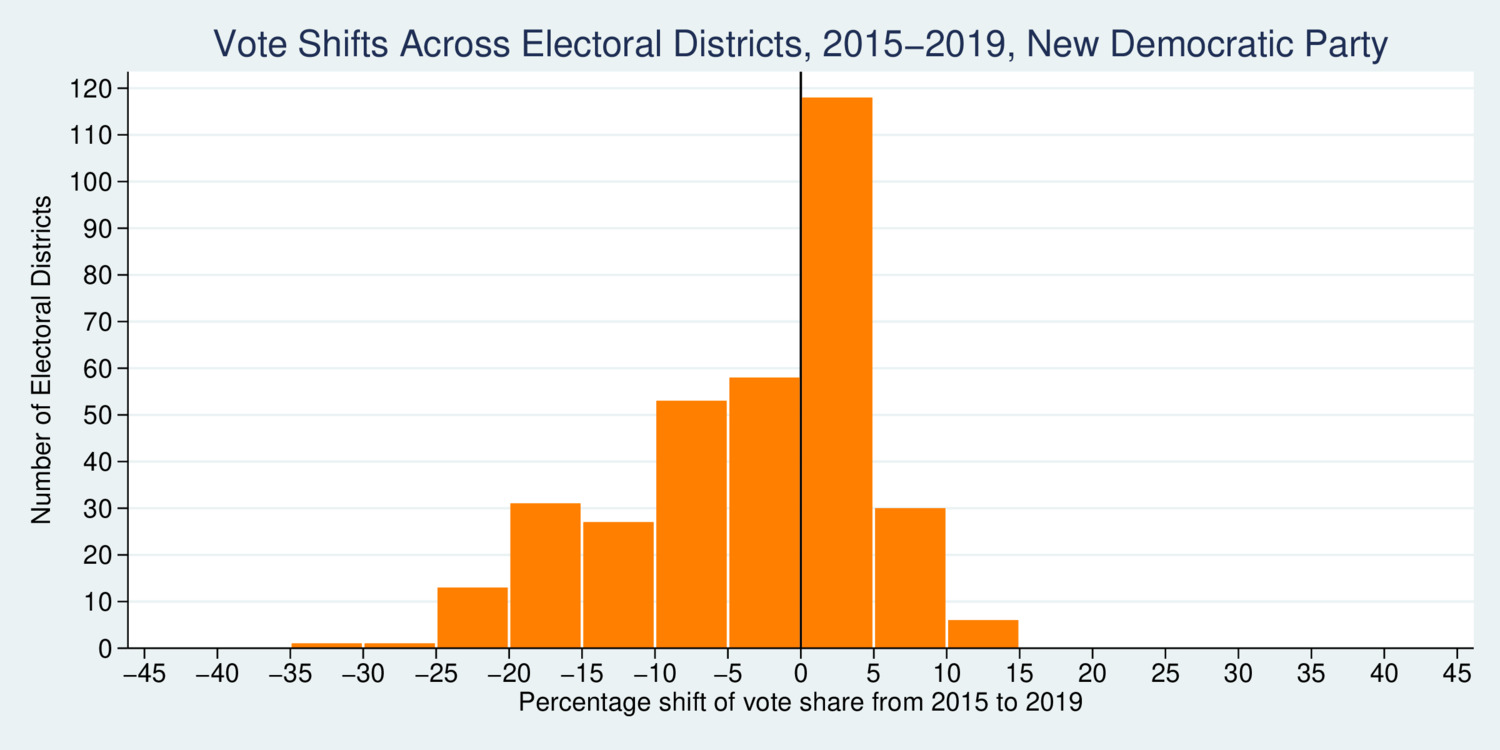
click on image for high-resolution PDF version
The NDP's results in 2019 were also quite mixed. Overall, the party suffered smaller losses than the Liberal Party. The NDP gained votes in 46% of the ridings and lost votes in 54% of the ridings. But what mattered was that where the party gained votes, the gains were small, while the losses were large where it lost votes. Ultimately, the party lost 20 seats.
The table below shows the seats parties gained or lost from 2015 to 2019. The diagonal (in green) shows the seats each party retained, while the off-diagonal cells (in red) show the losses to other parties.
The table shows that parties that even though the Conservative Party had a net gain in seats, it still lost five. The NDP lost 23 seats and picked up 3. The Liberal Party lost 34 seats but still managed to gain 7 from the NDP and Conservatives.
These non-uniform swings are important when predicting election outcomes. The overall political trends, as identified by national polls, mask much of the heterogeneity at the local level. When predicting seat distributions from national or regional polling data, one needs to take into account that local factors can vary significantly. The uniform-swing fallacy is found in various seat projections, including CBC's Poll Tracker. In the section "Methodology", the developers write:
The seat projection model uses a proportional swing method based on the difference between the results of the last election and current polls. [...] This swing is applied to every party in each riding.
This approach suppresses the volatility at the district level. Modeling non-uniform swing would require randomizing over the outcomes. It is not sufficient to simply allow for the margin of error in polling; it is also important to allow for the local heterogeneity in voting behaviour by taking into account the variance and covariance structure of vote swings across regions. Allowing for this additional source of volatility may not necessarily increase the range of seat predictions. Instead, knowing which ridings are more volatile than others, and how swings are correlated across space, can help make predictions more precise. There is yet more fun to be had developing the next generation of seat projection models.