In recent days crude oil prices have reached levels not seen since 2008, when they briefly spiked to over USD 140 per barrel in July 2008. Russia's invasion of Ukraine and the sanctions imposed on Russia's oil exports have reduced world supply in what was already a tight market. According to the International Energy Agency, Russian supply plays a significant role in global oil markets. With about 10% of global output share for crude oil, Russia is the world's third largest oil producer behind the United States and Saudi Arabia. However, Russia has been the world's largest exporter of oil to global markets. In December 2021, Russia exported 7.8 million barrels per day (mb/d) in total, of which crude oil was 5 mb/d, and refined oil products another 2.85 mb/d.
Markets responds to a shortfall of supply in two ways. Prices rise, and rising prices dampen demand while also enticing additional bust more costly supplies to enter the market. Because demand can react more quickly than new supply can enter the market, prices "overshoot" the new equilibrium price before settling on it. We see these price dynamics playing out in the market right now.
click on image for high-resolution PDF version
‘Strong backwardation suggests that oil markets will find a new equilibrium at lower price levels.’
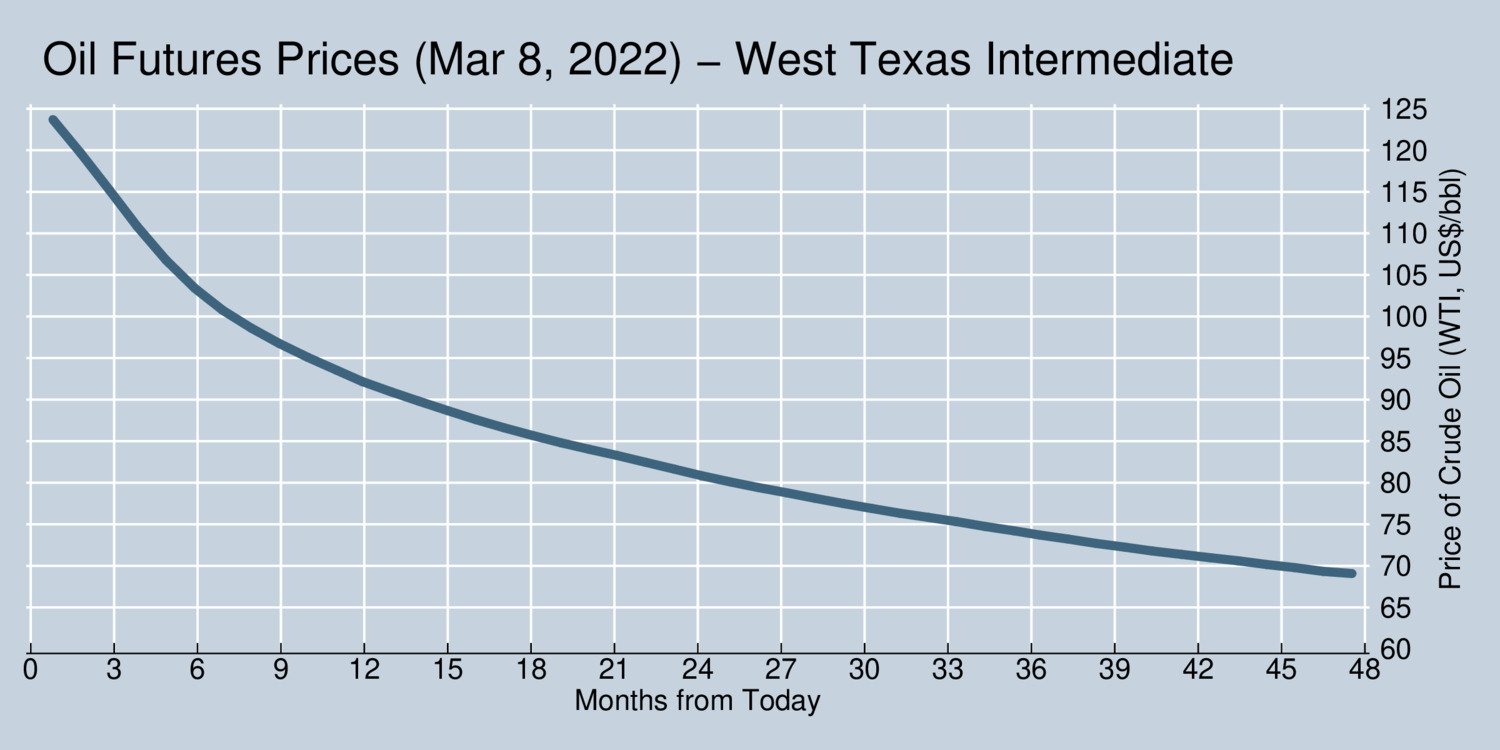
The chart above shows the futures prices for oil as of yesterday at end of market. Spot prices had topped US$125/bbl. However, as the chart reveals for futures contracts from one to 48 months into the future prices are trending significantly downward. This is known as strong backwardation. It indicates that markets believe that there will be a large price correction as new supplies are entering the market. The market expects long-term prices around US$70/bbl. Of course, in the short term we can continue to expect significant price volatility as the market reacts to news and events. Prices can still go higher before they start falling again. Economic logic tell us that prices will come down as long as there are additional sources of supply that can enter the market gradually. Strong backwardation suggests that oil markets will find a new equilibrium at lower price levels.
New supply will tend to come mostly from higher capacity utilization rather than new production capacity. Oil companies will be wary to invest into new exploration when the long-term trend points in the direction from fossil fuels. If anything, the high prices of oil today will accelerate this move away from fossil fuels. Contrary to what some pundits are suggesting, we are not at the beginning of a new oil boom.
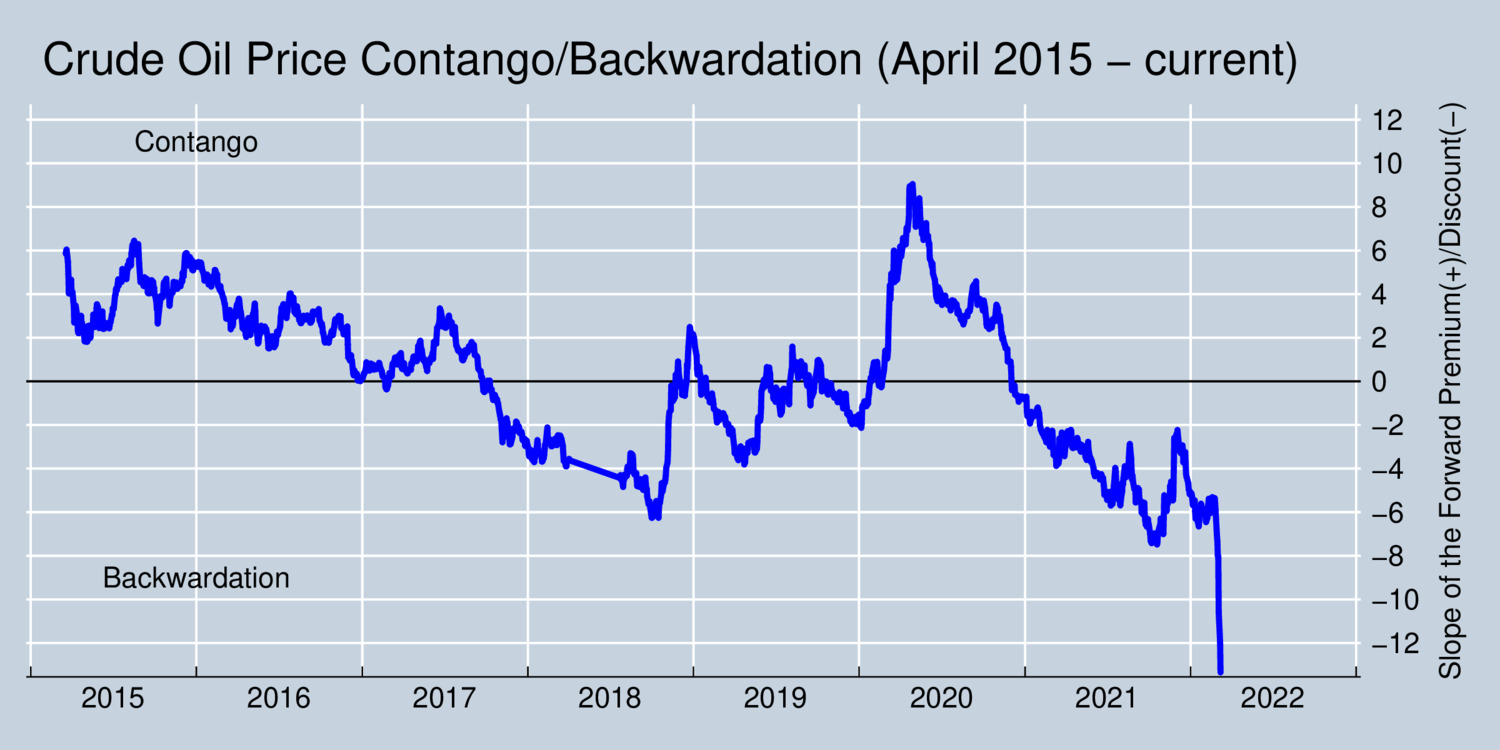
Let us have a closer look at the shape of the curve of oil price futures. One way to capture the steepness of this slope is through estimating the slope coefficient in the regression \[ p_{t,f}=\alpha_t+\beta_t\ln\left(\frac{f-t}{365}\right)\] Here, \(p_{t,f}\) is the price of crude oil on day \(t\) for delivery on day \(f\) in the future. The difference \((f-t)/365\) tells us how many years into the future this delivery occurs. Future markets are more liquid for near-horizon deliveries, but we see oil futures traded for even ten years into future as well. We can estimate this regression and determine the slop coefficient \(\beta_t\) for each trading day. The results of this analysis are shown in the graph below. When the slope is positive, the market is said to be in contango, and when it is negative, it is said to be in backwardation. I have estimated the slope coefficient for West Texas Intermediate crude prices using daily data from the Chicago Mercantile Exchange (CME).
click on image for high-resolution PDF version
Oil markets were in strong contango during the peak of the pandemic outbreak in 2020, but have been in backwardation since the beginning of 2021. Since the outbreak of Russia's war against Ukraine, spot prices have soared but the market also indicates increasing backwardation. This means that expectations of oil traders point to large market corrections later in 2022 that should bring prices down again.
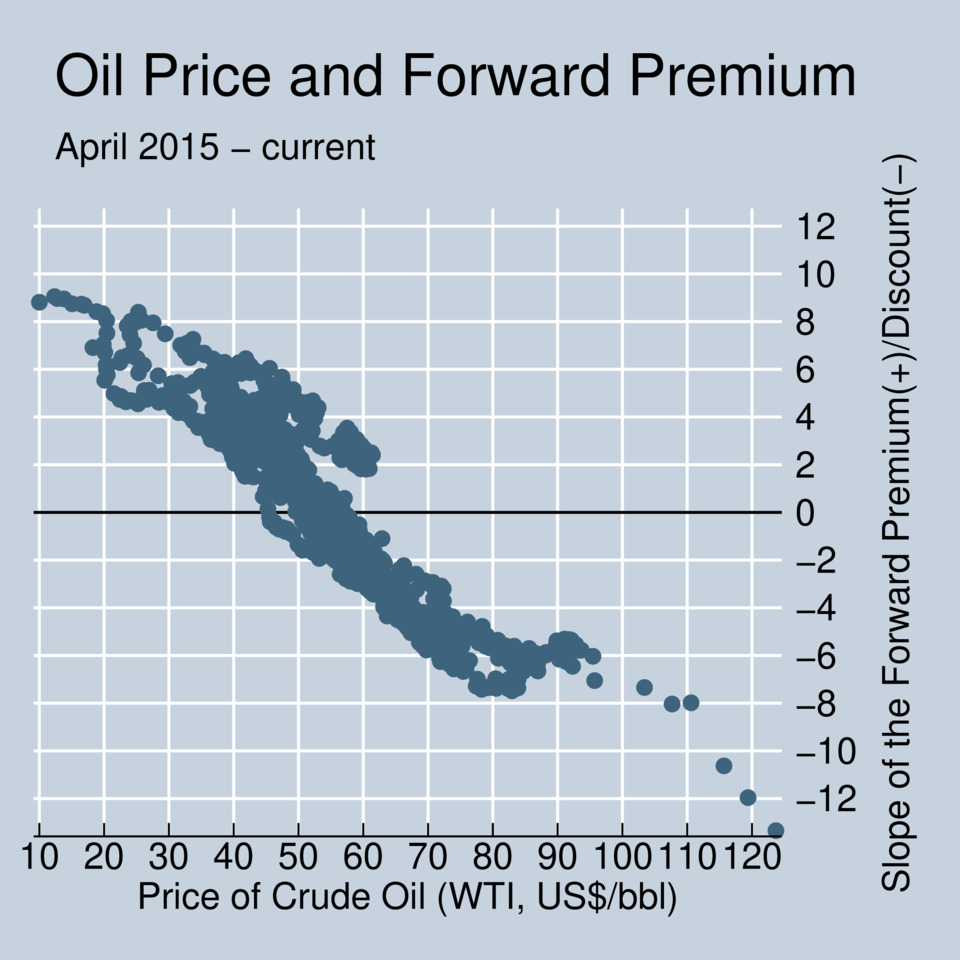
The estimated slope of the forward prices \(\beta_t\) can also be plotted against the current spot price of crude oil. The resulting scatter plot shows that markets tend to point towards the long-term equilibrium price. When spot prices are extremely low, prices are expected to rise, and when spot prices are extremely high, prices are expected to fall. This remains true in the current situation, as the next graph reveals.
click on image for high-resolution PDF version
When prices have risen to levels not seen since 2008, expectations followed. The dots at the bottom right indicate that the higher the prices, the steeper the backwardation. Markets clearly anticipate that additional supplies will make up some of the shortfall of oil products. There is clearly spare capacity in some producer countries that could be brought to market in the next weeks and months. On the other hand, high prices may also do their bit to curb demand.
It is also useful to look at the range where the forward curve is flat. That range indicates where the market believes the long-term equilibrium lies, at around US$50/bbl–US$60/bbl. Roughly, that is where world supply and world demand can meet under normal conditions. Removing output from Russia actually doesn't move this much because there is spare capacity in other countries, and not all of that is at higher price levels. Some OPEC countries have been holding back production to maintain price levels. At least some of this capacity will likely find its way to market in the next months. Spare capacity among OPEC countries is reckoned to be around 3.6 mb/d at the start of 2022, compared to about 4 mb/d in Russian capacity that may get locked out of international markets. Russia is expected to continue delivering oil to China and several other countries that have chosen to remain neutral in the conflict.
‘Instead of lowering fuel taxes to please motorists we need to invest much more into a future that is less dependent on fossil fuels.’
Some politicians are again calling for removal of energy taxes, ostentatiously to alleviate the burden on motorists. This is a profoundly misguided approach. Alberta, Canada's oil-producing province, has even gone so far as to suspend its gasoline tax. Of course, as an oil-producing jurisdiction they are now flooded with unexpected government revenue, and thus they can afford to. But even in Alberta this policy is misguided. The unexpected revenue windfall belongs to future generations of Albertans and should be invested in the Heritage Fund. Instead, Alberta's government subsidizes fuel consumption. High gasoline prices are the only way to curb demand in the short term, and interfering in the market essentially means that other markets have to adjust more to compensate for Alberta's continued profligacy in consuming oil. Other provinces should not follow Alberta's poor example, both because they cannot afford to revenue-wise and because it would steal funds from other needed investments, including building the needed infrastructure for tomorrow. Politicians should not be tempted by undue activism to intervene in markets. Intervention would make things worse, not better. Any relief that governments could provide would also be too small to matter. Instead of subsidizing fuel consumption by lowering taxes, we should invest into a future that is less and less dependent on fossil fuels.
Further readings and information sources:
- Clifford Kraus: Loss of Russian Oil Leaves a Void Not Easily Filled, Straining Market, The New York Times, March 9, 2022.
- International Energy Agency: Oil Market and Russian Supply.
- US Energy Information Administration: What drives crude oil prices: Supply OPEC.
- What oil bosses are saying about the global energy crisis, The Economist, March 9, 2022.