Prof. Werner Antweiler, Ph.D.
Showing election results on a geographically accurate map is often
frustratingly uninformative because electoral districts vary hugely
in size. In British Columbia, the smallest electoral district is a mere
3.5 square kilometers in size, while the largest is 196,484 square
kilometers. Superimposing electoral outcomes on a map thus distorts
the picture considerably. Enter the idea of a cartogram:
a map that changes the size and shape of places to show numbers
or data instead of actual land are. For elections, a particularly
useful type of cartogram involves hexagons of equal size that represent
electoral districts. The main idea is to preserve large-scale
geographic shapes and adjacency of districts as much as possible, but
not perfectly. There is always a visual trade-off involved—similar
to projecting a three-dimensional globe onto two-dimensional maps, only
more complicated. There is no good algorithm to do that, and thus what
I have put together I constructed "by hand", with a little bit of
empirical assistance to see how slightly different shapes scored on
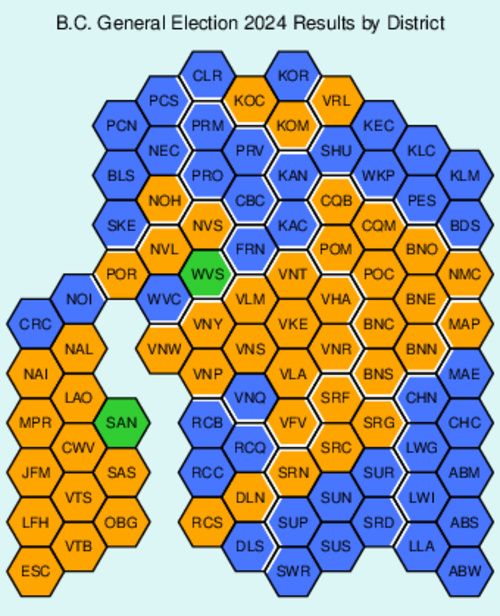
performance metrics. The cartogram below shows the outcome of the
2024 election in British Columbia for the three major parties, and
it shows nicely how the outcome varied geographically as well. Clearly
identified in the diagram are Vancouver Island and the other ten
regions of the province, including major cities and urban
areas (Vancouver, Surrey, Richmond-Delta, etc.). A full list of
constituencies, identified by their three-character codes, follows
right below the diagram. Further below are more diagrams and discussions.
The cartogram below has one oddity, but for a reason: Vancouver Island
appears attached to the mainland. This is because the North Island
eletoral district actually straddles the mainland, although
the Queen Charlotte Strait separates mainland from island. Most of the
district's population lives on Vancouver Island, and the artificial
land bridge is a compromise between "electoral fidelity" and
"geographic fidelity". As with all map-making, compromises need
to be made.
click on image for
high-resolution PDF version
British Columbia operates elections as a first-past-the-post system:
the candidate with the most votes is elected. This winner-takes-all
system makes for a simple picture where ridings are either blue,
orange, or green. But in truth each riding has rather different strengths
for particular parties, and some of the election results are pretty close.
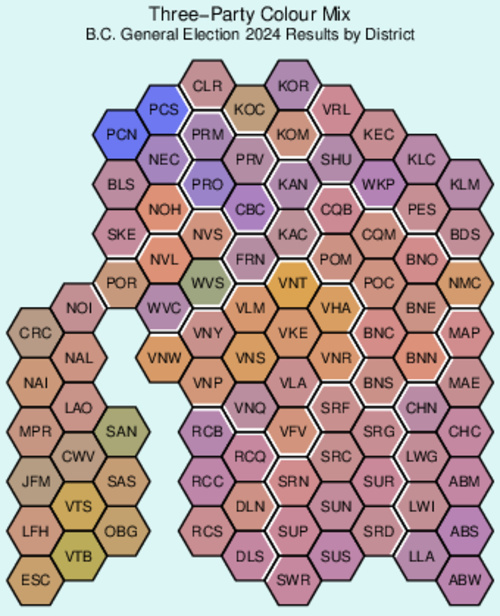
The next diagram shows the election results in a rather different way:
as a mixture of colours where the colour intensity reflects each of the
the three main parties' vote share. This turns the province into a map
from orange-y to purplish to greenish to blueish. Some districts show
dominance of one party, such as the Peace River districts in Northern
BC that are rather blue. Urban ridings in Vancouver show the strength
of the NDP, and Vancouver Island shows a lot more greenish hues.
click on image for
high-resolution PDF version
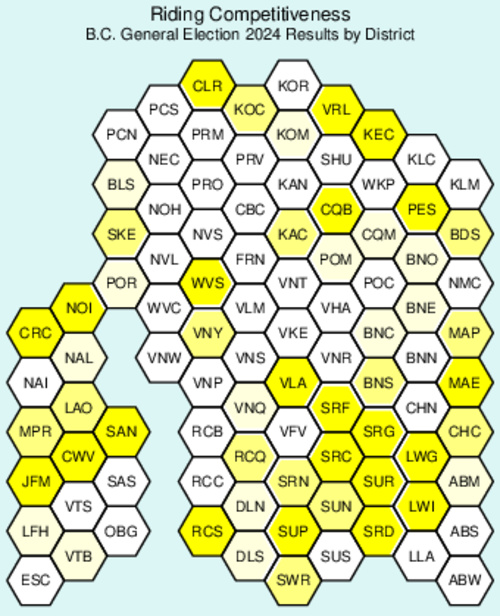
The third and last cartogram in this series shows the competitiveness
of each riding, with hues of yellow indicating whether the gap between
front-runner and runner-up was less than 5%-points (intense yellow),
less than 10%-points (medium yellow), or less than 15%-points (very light
yellow). The cartogram shows that there are many uncompetitive ridings,
which appear as white hexagons. The largest cluster of competitive ridings
is in Surrey, so expect campaigning there to be particularly intense.
But other ridings across BC may be considered competitive too: several
on Vancouver Island, and more across the entire province.
click on image for
high-resolution PDF version
Some may be interested in using my cartogram, and I am happy to share
the coordinates of the hexagons. They are recorded below in cubic
form so that q+r+s=0. Also reported are the three-character codes for
the reiding, the name of the riding, and the region to which it belongs.
Code,q,r,s,Name,Region
ABS,10,-5,-5,Abbotsford South,Fraser Valley
ABW,10,-6,-4,Abbotsford West,Fraser Valley
ABM,10,-4,-6,Abbotsford-Mission,Fraser Valley
BDS,10,1,-11,Boundary-Similkameen,Interior
BLS,2,6,-8,Bulkley Valley-Stikine,North
BNC,8,0,-8,Burnaby Centre,Burnaby-Coquitlam
BNE,9,0,-9,Burnaby East,Burnaby-Coquitlam
BNO,9,1,-10,Burnaby North,Burnaby-Coquitlam
BNS,8,-1,-7,Burnaby South-Metrotown,Burnaby-Coquitlam
BNN,9,-1,-8,Burnaby-New Westminster,Burnaby-Coquitlam
CBC,5,4,-9,Cariboo-Chilcotin,Cariboo
CHN,9,-2,-7,Chilliwack North,Fraser Valley
CHC,10,-3,-7,Chilliwack-Cultus Lake,Fraser Valley
CLR,4,7,-11,Columbia River-Revelstoke,Kootenays
CQB,7,3,-10,Coquitlam-Burke Mountain,Burnaby-Coquitlam
CQM,8,2,-10,Coquitlam-Maillardville,Burnaby-Coquitlam
CRC,0,4,-4,Courtenay-Comox,Vancouver Island
CWV,1,1,-2,Cowichan Valley,Vancouver Island
DLN,5,-2,-3,Delta North,Richmond-Delta
DLS,5,-3,-2,Delta South,Richmond-Delta
ESC,0,-1,1,Esquimalt-Colwood,Vancouver Island
FRN,5,3,-8,Fraser-Nicola,Interior
JFM,0,1,-1,Juan de Fuca-Malahat,Vancouver Island
KAC,6,3,-9,Kamloops Centre,Interior
KAN,6,4,-10,Kamloops-North Thompson,Interior
KEC,8,4,-12,Kelowna Centre,Interior
KLC,9,3,-12,Kelowna-Lake Country-Coldstream,Interior
KLM,10,2,-12,Kelowna-Mission,Interior
KOC,5,6,-11,Kootenay Central,Kootenays
KOM,6,5,-11,Kootenay-Monashee,Kootenays
KOR,6,6,-12,Kootenay-Rockies,Kootenays
LAO,1,2,-3,Ladysmith-Oceanside,Vancouver Island
LFH,0,0,0,Langford-Highlands,Vancouver Island
LLA,9,-5,-4,Langley-Abbotsford,Fraser Valley
LWG,9,-3,-6,Langley-Walnut Grove,Fraser Valley
LWI,9,-4,-5,Langley-Willowbrook,Fraser Valley
MAE,10,-2,-8,Maple Ridge East,Fraser Valley
MAP,10,-1,-9,Maple Ridge-Pitt Meadows,Fraser Valley
MPR,0,2,-2,Mid Island-Pacific Rim,Vancouver Island
NAI,0,3,-3,Nanaimo-Gabriola Island,Vancouver Island
NAL,1,3,-4,Nanaimo-Lantzville,Vancouver Island
NEC,3,6,-9,Nechako Lakes,North
NMC,10,0,-10,New Westminster-Coquitlam,Burnaby-Coquitlam
NOH,3,5,-8,North Coast-Haida Gwaii,North
NOI,1,4,-5,North Island,Vancouver Island
NVL,3,4,-7,North Vancouver-Lonsdale,North Shore
NVS,4,4,-8,North Vancouver-Seymour,North Shore
OBG,2,-1,-1,Oak Bay-Gordon Head,Vancouver Island
PCN,2,7,-9,Peace River North,North
PCS,3,7,-10,Peace River South,North
PES,9,2,-11,Penticton-Summerland,Interior
POC,8,1,-9,Port Coquitlam,Burnaby-Coquitlam
POM,7,2,-9,Port Moody-Burquitlam,Burnaby-Coquitlam
POR,2,4,-6,Powell River-Sunshine Coast,North Shore
PRM,4,6,-10,Prince George-Mackenzie,Cariboo
PRO,4,5,-9,Prince George-North Cariboo,Cariboo
PRV,5,5,-10,Prince George-Valemount,Cariboo
RCC,4,-1,-3,Richmond Centre,Richmond-Delta
RCB,4,0,-4,Richmond-Bridgeport,Richmond-Delta
RCQ,5,-1,-4,Richmond-Queensborough,Richmond-Delta
RCS,4,-2,-2,Richmond-Steveston,Richmond-Delta
SAN,2,1,-3,Saanich North and the Islands,Vancouver Island
SAS,2,0,-2,Saanich South,Vancouver Island
SHU,7,4,-11,Salmon Arm-Shuswap,Interior
SKE,2,5,-7,Skeena,North
SRC,7,-2,-5,Surrey City Centre,Surrey
SUN,7,-3,-4,Surrey North,Surrey
SUS,7,-4,-3,Surrey South,Surrey
SRD,8,-4,-4,Surrey-Cloverdale,Surrey
SRF,7,-1,-6,Surrey-Fleetwood,Surrey
SRG,8,-2,-6,Surrey-Guildford,Surrey
SRN,6,-2,-4,Surrey-Newton,Surrey
SUP,6,-3,-3,Surrey-Panorama,Surrey
SUR,8,-3,-5,Surrey-Serpentine River,Surrey
SWR,6,-4,-2,Surrey-White Rock,Surrey
VFV,6,-1,-5,Vancouver-Fraserview,Vancouver
VHA,7,1,-8,Vancouver-Hastings,Vancouver
VKE,6,1,-7,Vancouver-Kensington,Vancouver
VLA,6,0,-6,Vancouver-Langara,Vancouver
VLM,5,2,-7,Vancouver-Little Mountain,Vancouver
VNP,4,1,-5,Vancouver-Point Grey,Vancouver
VNQ,5,0,-5,Vancouver-Quilchena,Vancouver
VNR,7,0,-7,Vancouver-Renfrew,Vancouver
VNS,5,1,-6,Vancouver-South Granville,Vancouver
VNT,6,2,-8,Vancouver-Strathcona,Vancouver
VNW,3,2,-5,Vancouver-West End,Vancouver
VNY,4,2,-6,Vancouver-Yaletown,Vancouver
VRL,7,5,-12,Vernon-Lumby,Interior
VTB,1,-1,0,Victoria-Beacon Hill,Vancouver Island
VTS,1,0,-1,Victoria-Swan Lake,Vancouver Island
WKP,8,3,-11,West Kelowna-Peachland,Interior
WVC,3,3,-6,West Vancouver-Capilano,North Shore
WVS,4,3,-7,West Vancouver-Sea to Sky,North Shore
I am also sharing some bits of R code that may be helpful.
The first two functions, hex_x and hex_y, convert the (q,r,s)
coordinates into (x,y) coordinates. The third function, hex_polygon,
takes (x,y) coordinates and generates a hexagon polygon, which
can be stitched together into a sequence of polygons. Lastly,
hex_shared determines whether two polygons with coordinates
(q1,r1,s1) and (q2,r2,s2) share a common border, and if so,
win which direction. The function then returns the beginning
and end coordinates of that shared border, or NULL.
# Hexagon Helper Functions
hex_x <- function(q,r,s,size=1) { size*(3/2)*q }
hex_y <- function(q,r,s,size=1) { size*sqrt(3)*(r+q/2) }
hex_polygon <- function(x, y, id, colour, size = 1) {
angles <- seq(0, 2 * pi, length.out = 7)[-7]
data.frame(id = id, colour = colour,
x = x + size * cos(angles),y = y + size * sin(angles))
}
Polygons <- do.call(rbind, mapply(hex_polygon,
BCED$x,BCED$y,BCED$Code,BCED$colour,SIMPLIFY=FALSE))
hex_shared <- function(q1, r1, q2, r2, s1, s2, size=1) {
dir_key <- paste(q2-q1,r2-r1,s2-s1,sep=",")
indices <- switch(dir_key,
"1,0,-1" = c(0, 1),
"0,1,-1" = c(1, 2),
"-1,1,0" = c(2, 3),
"-1,0,1" = c(3, 4),
"0,-1,1" = c(4, 5),
"1,-1,0" = c(5, 0),
return(NULL)
)
angles <- indices * (pi / 3)
x1 <- size*(3/2)*q1
y1 <- size*(sqrt(3)/2)*(q1+2*r1)
v1 <- c(x1+size*cos(angles[1]),y1+size*sin(angles[1]))
v2 <- c(x1+size*cos(angles[2]),y1+size*sin(angles[2]))
return(c(v1,v2))
}