This is the second in a series of blogs about liquefied natural gas (LNG) in British Columbia. Today's topics is the international trade in LNG. Who are the exporters and importers, and what are the trends in international trade? The underlying data is from the WITS database of the World Bank where liquefied natural gas is reported as HS code 271111.
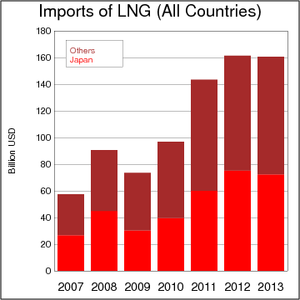
As the chart on the left shows, imports of LNG have risen significantly in the last few years, from about 100 billion US dollars in 2010 to about 160 billion US dollars in 2013. Part of this trend is an increasse in prices for LNG since 2011, and part is an increase in volume. In my previous blog on markets and prices, the increase in prices is particularly pronounced since the nuclear accident in Fukushima. The chart shows that Japan's imports (the bright red part of the bars in the chart) since 2010 contribute much to the overall increase. The remarkable rise in import value in just a few years has made LNG a lucrative business for many companies. The International Energy Agency (IEA) predicts that LNG demand could double by 2030 in its report The Golden Age of Gas. These are rosy projections that are based on numerous assumptions, some of which one may want to remain skeptical about.
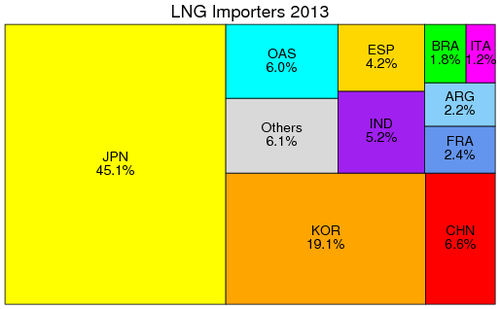
So who are the large importers of LNG? The tile chart below disaggregates the trade statistics for 2013 by importer country. Japan (JPN) accounts for nearly half of all LNG imots, followed by South Korea (KOR) with one-fifth of all imports. The next-largest importers are China (CHN) and India (IND). Argentina (ARG) and Brazil (BRA) are larger importers in South America, and Spain (ESP), France (FRA) and Italy (ITA) in Europe. Other Asian states (OAS) and other nations account for the remaining 12%.
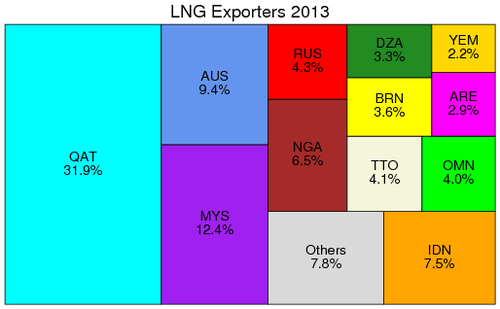
While demand for LNG remains quite concentrated, supply for LNG is quite concentrated as well. Roughly a third of world supply comes from a single country: Qatar (QAT). The tile chart below reveals the other big LNG exporter nations in 2013. Malaysia (MYS) and Indonesia (IDN) account for 12% and 8%, respectively. Australia accounts for one-tenth and is projected to grow significantly in coming years. In the Middle East, other important exporters are Oman (OMN), Brunei (BRN), and Yemen (YEM), and the United Arab Emirates (ARE). Two African nations also feature prominently on the list: Nigeria with 7% and Algeria (DZA) with 3%. Russia is also a supplier of LNG, but with 4% it is a relatively small player in the LNG market.
The question that British Columbians are interested in is how big a player BC may become in the LNG industry. BC's success depends critically on whether LNG from BC can remain competitive even when the stratospheric LNG prices today drop. It has been pointed out that BC is not a low-cost location for LNG. The vat majority of natural gas resources come from unconventional sources. In its Statistical Review of World Energy 2013, BP estimates that Canada's shale gas formations contain eight times as much as Canada's conventional gas reserves. Unconventional gas reserves are more expensive than conventional gas reserves, and this adds to the cost of Canadian LNG.
What is certain is that British Columbia will not rise to the top of LNG producers any time soon. Australia is quicker out of the gate and is predicted to outpace Qatar and become the world's largest producer of LNG. 70 percent of the global LNG capacity currently under construction is in Australia.
- An Overview of the World LNG Market and Canada's Potential for Exports of LNG, Canadian Association of Petroleum Producers, January 2014.
- Canadian LNG Projects, a list maintained by Natural Resources Canada
- Liquefied Natural Gas: The next leg of Canada's energy boom?, A special report from TD Economics, May 29, 2014.
- At a crossroads: considered a high cost oil and LNG producer, can Canada compete for capital in today's post-peak oil world?, PriceWaterhouseCoopers LLP, 2014.