Voters in British Columbia went to the polling stations on Tuesday, May 9, to cast their ballots in the 2017 provincial election. As of today, the outcome of this election remains uncertain as the counting of absentee ballots may still change the seats distribution in the Legislature. While it will be another couple of weeks before we will know who will form the next government in Victoria, it is clear that the BC Green Party is the big winner of this election. They have doubled their vote share, now reaching almost 17%, and their three members in the Legislature may well hold the balance of power.
The surge of the BC Green Party has raised the question if this has come at the expense of either the NDP or the BC Liberal Party. Many NDP supporters will probably argue that the surge of the BC Green Party has prevented them from winning an outright majority. Has the Green Party really "stolen" the election from the NDP? While many NDP supporters may believe that, the empirical reality points at a different source of the Green surge: higher participation.
The diagram below shows the share of the BC Green Party in each of the 84 ridings in which it fielded candidates plotted against the participation rate, i.e., the share of eligible voters who cast a ballot in each riding. It turns out that there is a statistically significant correlation. As the participation rate goes up by 1% in a riding, the Green's vote share goes up by about 0.72%. That is a remarkably strong effect and suggests that the BC Green Party benefited from mobilizing new voters. Where voters turned out in droves, they were more likely to vote Green. On other other hand, an empirical test of the Green Party share against the Liberal-NDP difference, a proxy for whether a riding is more left or right leaning, is statistically insignificant. If the Greens had simply gained at the NDP's expense, this variable would have been highly significant. It appears more plausible that in addition to raising participation, the Green Party received support from both left and right.
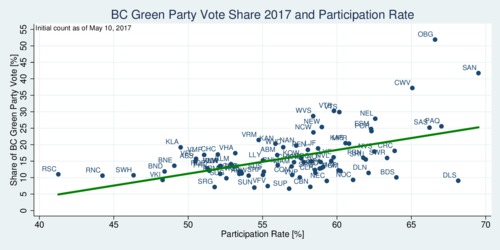
click on image to view high-resolution PDF version
If participation has boosted the BC Green's fortunes, is that simply a result of their political momentum or is there something else contributing to higher participation? The next chart correlates the participation rate against a measure of voter dispersion, the "effective number of political parties" in a riding. For example, "3" means that there are three equal-sized parties competing in a riding. Numbers in between indicate that vote shares are more concentrated or dispersed. The vote share of other parties and independents are lumped together, so the measure can range only between 1 and 4 in BC. There is clear positive correlation (even if we drop the outlier, the Peace River South riding, on the far left). When there is more effective choice, participation rates are up. The statistically significant effect suggests that when we add one effective party (say, go from 2 to 3), we add about 8.8%-points of voter participation. So perhaps it is fair to say that "more competition is good for democratic engagement".
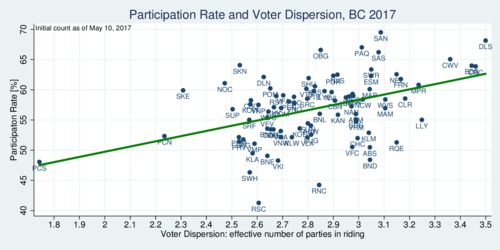
click on image to view high-resolution PDF version
And what about our electoral system? Again, some races were extremely close and may well tip the balance of power in Victoria. The diagram below shows the vote share of the winning party on the horizontal axis. Points to the left of the 50%-mark are shown in blue, indicating absolute majorities. Points to the left of the 50% are shown in red and indicate relative majorities. The vertical axis shows the margin by which a riding was won, i.e., the difference between the winner's and the runner-up's vote share. It is apparent that many races were won with relative majorities, and the lowest with about 37% in tight three-way races.
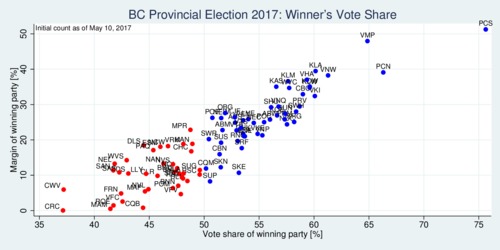
click on image to view high-resolution PDF version
The election outcome this year will surely bring electoral reform back on the agenda. Both the Greens and the NDP have related points in their electoral platforms. Under proportional representation, the BC Green Party would have won 15 seats rather than 3, and both the NDP and BC Liberals would have won 36 seats. The outcome of the election would be clear: two parties would have to cooperate to form a coalition. Instead, BC will end up with the balance of power determined in a single riding (Comox) where the vote difference is a mere nine votes at this point. The first-past-the-post system introduces an element of randomness into the outcome. Who wins or loses depends on how the support for individual parties is concentrated or dispersed. Some parties have "more efficient" support than others.
More on this topic can be found in my two blogs The case for electoral reform in Canada (July 27, 2015) and Electoral reform in Canada after the October 2015 election (Nov. 27, 2015). I have also written a research paper on electoral reform in Canada, introducing a new hybrid system: The PR-OAC-tive Electoral System. It is essentially a type of proportional representation (PR) with optimal assignment of constituencies (OAC) to achieve effective local representation. A local non-partisan advocacy group, Fair Voting BC, makes the case for electoral reform in BC and in Canada. The group plans to launch a Charter Challenge and is raising funds towards that goal.
* * *
Technical note: The voter dispersion measure is the exponential of the Wiener entropy. If \(p_i\) is the vote share for each of the \(i=1,..n\) parties, then the effective number \(n^\ast\)of parties is: \[n^\ast=\exp\left[-\sum_{i=1}^n p_i\ln(p_i)\right]\]