In my blogs The case for electoral reform in Canada and Electoral entropy: the case for electoral reform continued I have shown statistics from the 2011 federal election that showed how Canada's first-past-the-post system leads to representation where 53% of all ridings were won without a majority. In this blog I am updating these charts with results from the October 19, 2015 federal election that ushered in a new Liberal era in Canada. So what else has changed from 2011 to 2015?
First, the table below shows that the number of ridings won by pluralities (<50%) rather than outright majorities (>50%) has increased somewhat, from 53% to 61%. British Columbia is now holding the record for having the largest share of ridings won with bare pluralities (81%), followed closely by Quebec (76%).
The next diagram shows the distribution of winning vote shares across all of Canada. The red bars indicate (<50%) pluralities, and the green bars indicate (>50%) majorities. A total of five ridings, all located in Queebec, were won with vote shares less than 30%: Jonquière, Montmagny-L'Islet-Kamouraska-Rivière-du-Loup, Pierre-Boucher-Les Patriotes-Verchères, Québec City, and Saint-Hyacinthe-Bagot.
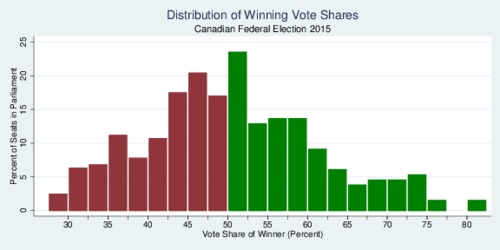
click on image for high-resolution PDF version
Another way to look at this issue is to tabulate the winning margin in each riding, that is the percentage point difference between the winning candidate and the second-placed candidate. The diagram below shows how tight many races are. Some 10% of ridings are won with a margin of less than 2.5%, and about a third of all ridings are won with a margin of less than 10%.
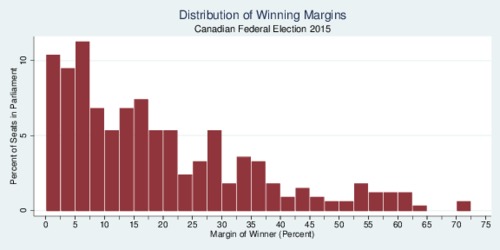
click on image for high-resolution PDF version
As in my previous blog, it is again interesting to look at the actual number of votes that winning candidates received. The diagram below illustrates that some members of parliament were elected with the support of less than 10,000 voters, while some members of parliament were elected with the support of more than 40,000 voters.
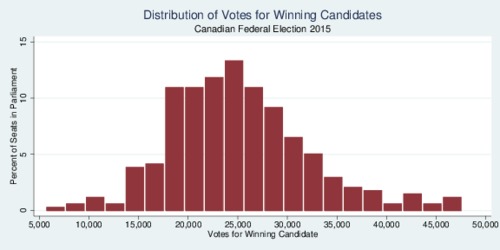
click on image for high-resolution PDF version
The last of my charts looks at the "effective" number of parties competing in each ridings, using the entropy index discussed in my previous blog. It shows strongly that most races in Canada are three-way races, and a distinct number of ridings (especially in Quebec) have four-way races.
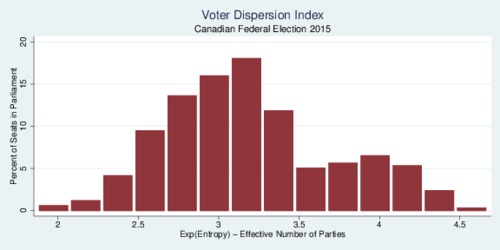
click on image for high-resolution PDF version
So what does one take away from these numbers and charts? First, the first-past-the-post system continues to generate weak representation: more than three-fifth of ridings are won with mere pluralities rather than majorities. Second, winning margins tend to be very small in many ridings, leading to what can best be described as "spurious" pluralities where small swings would have produced rather different outcomes. This introduces a large amount of randomness into the outcome—something that is mirrored in the difficulty of translating vote share predictions from the polls into seat share predictions for the House of Commons. Third, for the winning party it was again sufficient to secure the support of 40% of the vote to obtain a majority of seats. Whether these are desirable features of our voting system is a matter for debate. Ultimately, a case can be made for the notion that elected members of the House of Commons should at least represent a majority of constituents, rather than less than a third as in some ridings. The easiest reform of our electoral system involves the introduction of ranked voting or instant-runoff voting. A more appealing reform would involve mixing first-past-the-post with proportional representation, a voting system described as mixed member proportional (MMP) representation. There are many different forms of MMP, but they have in common that voters would be given two votes: one for a local representatie in the current first-past-the-post fashion, and one for a political party that determines the share of additional seats for that party in parliament. For example, instead of electing 338 members of parliament in each riding, 169 members would continue to be elected directly (in ridings twice as large as now), and 169 members would be elected through party lists (ideally separate in each province). In addition, an electoral threshold for party-list mandates is often required, typically ranging from 2-5%.
If MMP had been used in the last election in October, what would the result have been? Let us assume that the direct mandates are exactly one half of what they turned out to be in practice, so 184/2=92 Liberal seats, 99/2=50 Conservative seats, 44/2=22 NDP seats, 10/2=5 Bloc Quebecois seats, and no Green seat. Using the vote shares, and assuming a minimum 3% vote share for winning party-list seats in the House of Commons, there would be an additional 0.395×169=68 Liberal seats, 0.319×169=54 Conservative seats, 0.197×169=33 NDP seats, 8 Bloc seats, and 6 Green seats. So the grand total number of seats would have been: 160 Liberal, 104 Conservative, 55 NDP, 13 Bloc, and 6 Green. In other words, the outcome would have been a Liberal minority rather than a Liberal majority. Whether you like this better than the actual outcome is much a matter of political preference. Many think that a strong majority government is better than a weak minority government, while others think that the lack of clear majorities with MMP would lead to coalition building. Which outcome strengthens democracy, encourages voter engagement, and leads to longer-lasting political compromises remains a question that Canada will be debating in the months and years to come. In my view, the current system is less than ideal. Incremental, albeit cautious, electoral reform ought to be on our agenda.
You may also wonder how a true proportional representation system would have turned out. There are three important complications to consider. First, our 338 seats are divided up by province and territory, and thus the share of representatives from each party must be calculated at the provincial level rather than the national level. Second, a method of rounding must be used. The system most-widely used today is the Sainte-Laguë method for allocating seats by highest quotient. The table below shows how the provincial vote shares translates into seats by province, and then summed up to the national total in the last row. In the three Northern territories the method amounts to first-past-the post, and in Prince Edward Island with four seats in total the allocation of seats leaves the Green Party without representation even though they gained 6.1% of the votes. Third, a percentage threshold needs to be defined to prevent fringe parties from gaining seats. In the calculations below I have used a low threshold (2%). In some jurisdictions the threshold is much higher (e.g., Germany uses 5%). With the 2% threshold, the Green Party gains seats in Alberta, B.C., Ontario, and Quebec.
The table belows provides an accurate reflection of how the October 2015 would have translaed into actual seats based on proportional representation and provincial party lists. The provincial allocation system gives a slight benefit to the large parties. For example, the Liberal party would receive 40.5% of the seats with 39.6% of the votes—but arguably that its fairer than receiving 54.4% of the seats with 39.6% of the votes.
| Province | Seats | LIB | CPC | NDP | BLQ | GRP |
|---|---|---|---|---|---|---|
| Alberta | 24.6% | 59.7% | 11.5% | 2.6% | ||
| 34 | 8 | 21 | 4 | 1 | ||
| British Columbia | 35.0% | 30.3% | 25.8% | 8.2% | ||
| 42 | 15 | 13 | 11 | 3 | ||
| Manitoba | 44.2% | 38.1% | 13.3% | 3.3% | ||
| 14 | 6 | 6 | 2 | 0 | ||
| New Brunswick | 51.5% | 23.5% | 20.5% | 4.4% | ||
| 10 | 5 | 3 | 2 | 0 | ||
| Newfoundland | 63.3% | 10.4% | 20.2% | 1.0% | ||
| 7 | 5 | 1 | 1 | 0 | ||
| Nova Scotia | 63.0% | 17.6% | 15.7% | 3.3% | ||
| 11 | 7 | 2 | 2 | 0 | ||
| Northwest Territ. | 48.3% | 18.3% | 30.5% | 2.8% | ||
| 1 | 1 | 0 | 0 | 0 | ||
| Nunavut | 47.2% | 24.8% | 26.5% | 1.5% | ||
| 1 | 1 | 0 | 0 | 0 | ||
| Ontario | 44.9% | 35.1% | 16.5% | 2.8% | ||
| 121 | 55 | 43 | 20 | 3 | ||
| P.E.I. | 59.7% | 18.7% | 15.0% | 6.1% | ||
| 4 | 2 | 1 | 1 | 0 | ||
| Quebec | 35.7% | 16.7% | 25.4% | 19.4% | 2.2% | |
| 78 | 28 | 13 | 20 | 15 | 2 | |
| Saskatchewan | 23.4% | 49.3% | 24.7% | 2.1% | ||
| 14 | 3 | 7 | 4 | 0 | ||
| Yukon | 53.7% | 24.3% | 19.4% | 2.6% | ||
| 1 | 1 | 0 | 0 | 0 | ||
| Canada | 39.6% | 31.9% | 19.6% | 4.6% | 3.4% | |
| 338 | 137 | 110 | 67 | 15 | 9 |
Let me conclude by pointing out one of the significant advantages of PR by provincial party lists. In Atlantic Canada, the Liberals received all seats in the last election. With PR, there would be some representation from the NDP (6) and Conservatives (7). Similarly, in Alberta the Liberals won only 4 seats, and the NDP 1. Under PR they would have received 8 and 4 seats, respectively. As the Liberals are forming a majority government, Alberta remains underrepresented in their caucus, and Atlantic Canada overrepresented. PR by provincial party lists avoids these regional imbalances.
Recent Blog Entries
- Should data centres provide demand flexibility to protect BC's electricity grid? (June 8)
- Wind power is growing in British Columbia (June 5)
- Canada needs better rail, but not high-speed rail (June 2)
- How are Canada's electric vehicle imports trending? (May 9)
- The 2026 oil shock may become larger than you think (April 30)
- Improving road safety and saving lives with Leading Pedestrian Intervals (April 2)
- Where are BC's LNG exports sailing to? (March 27)
- Driving electric has become much more beneficial (March 17)
- Today's ruling by the U.S. Supreme Court won't end Trump's trade wars (February 20)
- America's Federal Reserve must stay independent (January 13)
- What good are stablecoins? (19 Dec 25)
- Canada's alcohol imports have shifted (27 Nov 25)
Topics
Months
Subscribe to RSS feed ![]()