BC Hydro announced the winners of the Call for Power last week. I had commented about this in my blog British Columbia gets more power. Seven wind farms have been selected, and some have been wondering why there were only wind farms in the mix. Was it just lower cost, or did other factors play a role?
| Quarter | Cost [$mio] |
Energy [GWh] |
Avg. Price [$/MWh] |
|---|---|---|---|
| 2017Q2 | 315 | 4,203 | 74.95 |
| 2017Q3 | 395 | 4,318 | 91.48 |
| 2017Q4 | 346 | 3,400 | 101.76 |
| 2018Q1 | 256 | 2,433 | 105.22 |
| 2018Q2 | 315 | 4,414 | 71.36 |
| 2018Q3 | 363 | 4,162 | 87.22 |
| 2018Q4 | 326 | 3,144 | 103.69 |
| 2019Q1 | 227 | 2,528 | 89.79 |
| 2019Q2 | 325 | 4,188 | 77.60 |
| 2019Q3 | 377 | 4,419 | 85.31 |
| 2019Q4 | 327 | 3,217 | 101.65 |
| 2020Q1 | 274 | 2,651 | 103.36 |
| 2020Q2 | 324 | 3,698 | 87.61 |
| 2020Q3 | 398 | 4,246 | 93.74 |
| 2020Q4 | 391 | 3,945 | 99.11 |
| 2021Q1 | 290 | 2,741 | 105.80 |
| 2021Q2 | 350 | 4,487 | 78.00 |
| 2021Q3 | 410 | 4,594 | 89.25 |
| 2021Q4 | 422 | 4,438 | 95.09 |
| 2022Q1 | 340 | 3,305 | 102.87 |
| 2022Q2 | 361 | 4,484 | 80.51 |
| 2022Q3 | 426 | 4,743 | 89.82 |
| 2022Q4 | 352 | 3,512 | 100.23 |
| 2023Q1 | 282 | 2,670 | 105.62 |
| 2023Q2 | 355 | 4,419 | 80.33 |
| 2023Q3 | 343 | 3,578 | 95.86 |
| 2023Q4 | 358 | 3,220 | 111.18 |
| 2024Q1 | 325 | 2,450 | 132.65 |
| 2024Q2 | 282 | 3,742 | 75.36 |
| 2024Q3 | 377 | 3,847 | 98.00 |
The table on the left shows the quarterly cost of electricity purchases from independent power producers (IPPs) in British Columbia. These numbers were obtained from quarterly and annual financial reports from BC Hydro. They show the quarterly cost in millions of dollars, the energy purchased in Gigawatthours [GWh], and the average purchase price in dollars per Megawatthour [$/MWh].
Since 2017, the capacity of IPPs has remained relatively stable, and the energy purchased has typically hovered around the 13,000 GWh/year range. There is some variation in purchase prices, which reflects the particular way how energy purchases are compensated in BC Hydro's Electricity Purchase Agreements (EPAs) with the IPPs.
Looking at the last fiscal year 2023/24 which ended in March 2024, BC Hydro paid on average $101/MWh on purchases from IPPs. The levelized cost of electricity from Site-C dam is actually not that much higher despite the significant cost overruns. Time will tell how the new projects will shape up once they come online.
The table below provides a summary of all off the IPP projects in British Columbia, organized in descending order by the energy generation potential of each category. Non-storage hydro projects dominate, and this term describes run-of-the-river hydro projects such as the 50 MW Ashlu Creek station near Squamish. Storage hydro are dams such as the 185 MW Arrow Lakes dam near Slocan. Wind farms only account for a small part of the IPP total energy supply. The bulk is hydro. BC Hydro also ends up buying less than the nominal energy potential of all the IPPs: only about 13 Terwatthours [TWh] out of 19 TWh.
| Category | Number | Capacity [MW] |
Energy [GWh/a] |
Share [%] |
|---|---|---|---|---|
| Non-Storage Hydro | 69 | 1,990.0 | 7,411.2 | 39.3 |
| Storage Hydro | 12 | 1,287.4 | 4,923.7 | 26.1 |
| Biomass | 18 | 875.6 | 3,083.1 | 16.4 |
| Wind | 10 | 747.0 | 2,161.8 | 11.5 |
| Gas Fired Thermal | 2 | 128.8 | 904.7 | 4.8 |
| Waste to Energy (MSW) | 1 | 24.8 | 166.0 | 0.9 |
| Energy Recovery Generation | 4 | 22.8 | 141.0 | 0.7 |
| Biogas | 3 | 6.4 | 48.1 | 0.3 |
| Solar | 2 | 1.4 | 3.9 | 0.0 |
| Total | 121 | 5,084.2 | 18,843.5 | 100.0 |
BC Hydro does not make public the bids from individual IPPs. BC Hydro selects the lowest-cost qualified bidders, and in fact accepted bids for a total of five TWh/year, more than what they had originally announced as 3 TWh/year. That is a very strong indication that bids came in at the lower end, making the capacity expansion economically attractive.
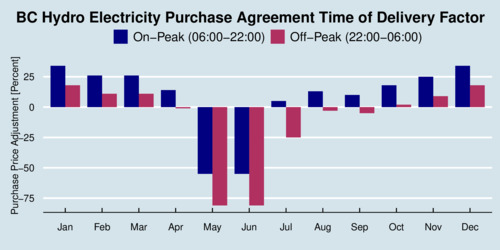
BC Hydro's Electricity Purchase Agreements (EPAs) do not pay a flat feed-in-tariff but instead pay a price that is adjusted for seasonal variation and diurnal variation. The diurnal variation is covered by a differential tariff for on-peak daytime supply (between 06:00 and 22:00) and off-peak nighttime supply (between 22:00 and 06:00). The blue bars in the diagram below show the on-peak tariffs, and the red bars show the off-peak tariffs. The IPP's (secret) bid price is adjusted by the time-of-delivery factors to determine what they will receive as compensation. For example, during February and March, the on-peak price is 25% higher than the base rate.

click on image for high-resolution PDF version
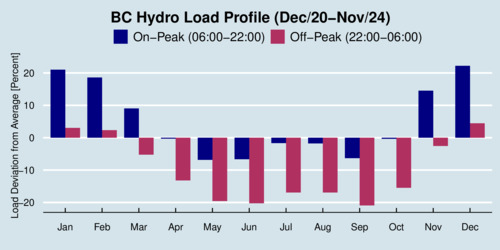
The adjustment factors vary seasonally, which in part coincides with the seasonal structure of electricity demand in BC. Electricity demand peaks in the winter months due to the use of electricity for heating homes. The chart below shows BC's electricity load profile over the last four years, also expressed in percentage deviations from the overall average.

click on image for high-resolution PDF version
The Time-of-Delivery Factors (TDFs) do not merely reflect load deviations, when one compares the two charts. BC Hydro incentivizes capacity that is winter-peaking so that new IPP facilities provide both power capacity and energy capacity. Power capacity is needed in the winter. Because wind is stronger in the winter than the summer, wind is favoured by the TDFs. It is therefore not at all surprising that only wind farms were ultimately selected to provide additional power in British Columbia. The TDFs are designed to help select additional generation capacity that is most complementary to the existing hydro infrastructure. That makes eminent sense economically.
![[Sauder School of Business]](logo-ubc-sauder-2016.png)
![[The University of British Columbia]](logo-ubc-2016.png)