Canada's 44th federal election took place on September 20, 2021, and produced another minority government. It goes to show that majority government have become the exception, and minority governments have become the norm. I have argued that Canada deserves an electoral system that matches its diverse political landscape. Yet, chances of it happening remain slim. The graphs below summarize some of the key statistics that continue to make the case for electoral reform.
click on image for high-resolution PDF version
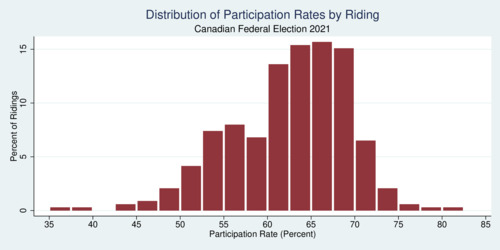
Participation in elections across the country is far from uniform. The graph above shows that participation rates can vary tremendously across the 338 ridings in Canada. There is a small but noticeable positive correlation between choice (number of competitive parties in a riding) and voter turnout. However, there is no positive correlation between how close a race is in a riding and voter turnout. Yet, the distribution of participation is quite wide, and it begs the question what is driving this very unequal level of political engagement across Canada. A few ridings had participation rates below 50%.
click on image for high-resolution PDF version
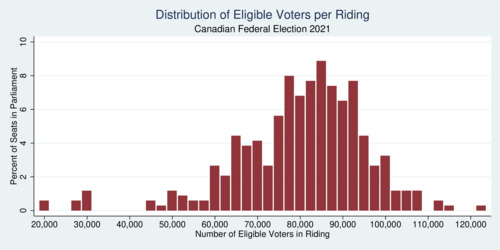
‘The unequal size of electoral districts distorts election outcomes.’
The distribution of eligible voters per riding also remains somewhat worrisome. There is a constitutional clause that protects representation from small Atlantic provinces, but there is a significant difference even across individual provinces. It suggests that redistricting is not keeping up with population change, leading some ridings too large. The average riding captures about 80,000 voters, while the largest captures nearly 123,000. (The smallest riding had only 19,000 eligible voters.) This inequity is one of the primary reasons for electoral reform towards proportionality. The current district size dispersion is patently unfair.
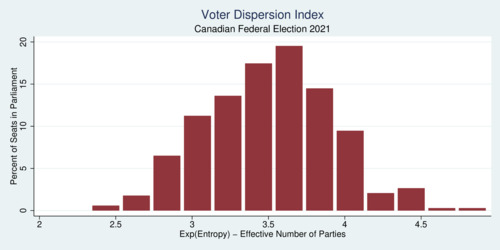
‘Canada's political landscape is diverse: t is not a two-party system as in the U.S.’
The next chart shows a voter dispersion index, which I explained in my electoral entropy blog published in 2015. The index captures the "effective number of parties", describing if ridings are essentially one-way (one highly dominant party), two-way, three-way, or four-way. Canada is clearly no longer a two-party system as in the United States. The distribution in the chart clearly shows that most ridings are 3-way or 4-way competitions. Thus the first-past-the-post system that is originally meant for a two-party system is wholly inadequate to capture Canada's diverse political landscape.
click on image for high-resolution PDF version
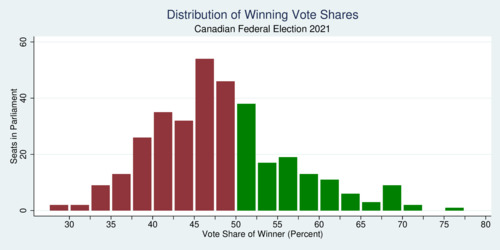
What makes the current first-past-the-post electoral system very disconcerting is its failure to capture majorities of voters in the majority of ridings. Put another way, most elected parliamentarians represent less than half of the voters in their riding. The next chart shows this distribution. The bars in green indicate all the ridings where the winner's vote share was above 50%, while the red bars show the ridings that were won with less than 50%. At the far end of the distribution, several ridings were won with less than 35% of the vote! This means that two-thirds of the voters in those ridings did not want to be represented by this candidate.
click on image for high-resolution PDF version
‘Two-thirds of ridings are won by mere or weak pluralities.’
It is interesting to look at this distribution of winning margins across the different provinces, shown in the table below. It shows how many seats were won without a majority. Across Canada, 65% of the seats were won without majority. Only in Alberta and Saskatchewan was the majority of seats won with a majority, but in all other provinces and territories most seats are mere-plurality seats. Among the larger provinces, British Columbia tops the list. A staggering 88% of all seats are mere-plurality seats.
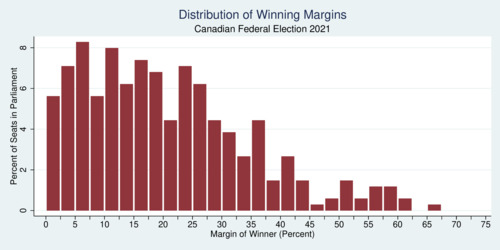
Another perspective on the election is the distribution of winning margins across ridings. A significant number of ridings is won by small margins. The average winning margin is about 20%, but there are a number of ridings that are won with razor-thin margins. The smallest margins in 2021 were 0.02%. 0.14%, 0.16%, and 0.32%. These results almost amount to a flip of a coin, and unsurprisingly were contested by judicial recounts. The very notion of "flipping a riding" to win elections makes it clear that parties try to win elections not by appealing to broad swaths of voters but instead on voters in ridings they consider "flippable". This focus on the 10% of ridings in that category is also patently unfair and can lead to disproportionate allocation of resources to these ridings in order to win their favour. This in turn is unfair with respect to non-competitive ridings.
click on image for high-resolution PDF version
The bottom line is that the case for electoral reform remains strong after Canada's 44th federal election. The current system is rampant with distortions that result in representing some voter groups and ridings disproportionately. It is high time that Canada moved towards a 21st century voting system that is fair and equitable. Each vote must count equally, and the only concession ought to be the constitutional protection on minimum provincial representation. Within these constitutional constraints, Canada's parliament is at liberty to pursue electoral reform.