On Saturday, November 15, 2014, Vancouver elected new city councillors, park board commissioners, and school trustees. Mayor Gregor Robertson was re-elected for a third term and can continue to count on a majority in the 10-seat city council with his Vision Vancouver (VV) team. However, control of the Park Board went to the Non-Partisan Alliance (NPA), and on the 9-seat Vancouver School Board NPA and VV both won 4 seats, with the single Green Party trustee holding the balance of power.
I got to vote only for the school board because I live on the UBC campus, which is outside Vancouver but within the school district. With 29 names to choose from, the ballot was predictably long—and ordered neatly in alphabetical order of the candidates. It has been well established in the political science literature that ballot order matters, and thus I was somewhat surprised to find that Vancouver is still following the traditional alphabetical ordering. My curiosity was raised, and as a researcher with the right empirical tools at hand, I went to find out if ballot order mattered in Vancouver too. You will probably not be surprised to learn that it does.
Ballot order research
Ballot order matters. That is what numerous pieces of academic research demonstrate convincingly. Most of this research comes from political scientists, but it also bears close resemblance to similar problems that we encounter in economics, marketing, and psychology: "framing effects". Such effects occur when the order of presentation influences a person's behavior, such as consumption choices or voting on a ballot. Recent research by Yuval Salant (Kellogg School of Management) and Marc Meredith (University of Pennsylvania) shed light on such framing effects in municipal elections. The article First Among Equals? discusses their research on a non-technical level. They found clear evidence of an advantage for a first-listed candidate. But this is by far not the only piece of evidence. Below I have assembled a short list of research articles and one newspaper story in chronological order. Political scientists may forgive me if I am not aware of other important research in this area, and therefore consider the list below a representative sample.
- Joanne M. Miller and Jon A. Krosnick: The Impact of Candidate Name Order on Election Outcomes, Public Opinion Quarterly 62(3), Autumn 1998, pp. 291-230
- J.G.S. Koppell and J.A. Steen: The Effects of Ballot Position on Election Outcomes, Journal of Politics 66(1), February 2004, pp. 267-281.
- Thorsten Faas and Harold Schoen: The importance of being first: Effects of candidates' list positions in the 2003 Bavarian state election, Electoral Studies 25(1), March 2006, pp. 91-102.
- Daniel E. Ho and Kosuke Imai: Randomization Inference with Natural Experiments: An Analysis of Ballot Effects in the 2003 California Recall Election, Journal of the American Statistical Association 101(475), 2006, pp. 888-900.
- Jon A. Krosnick: In the Voting Booth, Bias Starts at the Top, The New York Times, November 4, 2006.
- J. Wood, D. Badawood, J. Dykes, and A. Slingsby: BallotMaps: Detecting Name Bias in Alphabetically Ordered Ballot Papers. IEEE Transactions on Visualization and Computer Graphics 17(12), 2011, pp. 2384-2391.
- Marc Meredith and Y. Salant: On the causes and consequences of ballot order effects, Political Behavior 35(1), March 2013, p. 175-197
- Eric Chen, Gabor Simonovits, Jon A. Krosnick, and Josh Pasek: The impact of candidate name order on election outcomes in North Dakota, Electoral Studies 35, September 2014, pp. 115-122
‘Ambivalence and lack of information underlie candidate name order effects.’
Newer studies confirm the existence of a rank-order bias not only through analyzing election outcomes with alphabetically-ordered ballots, but also from election outcomes with quasi-random assignment of candidates name orders. Political scientists have tried to explain the prevalence of the phenomenon. Chen et al. (2014) conclude that their findings ‘provide evidence in line with proposals that a lack of information and ambivalence underlie candidate name order effects.’ Nowhere is this effect more pronounced than in municipal elections where (a) voting turnout is low, (b) voters do not feel that the outcome matters much to them, (c) party identification may be vague to many voter (an outsider would not infer political affiliations from the name "Non-Partisan Alliance", for example), and (d) individual candidates have limited ability to reach out to voters directly.
Data sources
The City of Vancouver has election data available on their web site in the Open Data Catalogue — Municipal election results. I have downloaded the 2014 results and transformed them into a more usable data file for empirical analysis: Vancouver municipal election 2014 results by polling station. This file with 14,170 data points has five columns: election (PC, ST, CC for park commissioner, school trustee, and city councillor, respectively); polling station code, candidate name (last name, first name), and votes cast. In addition to each polling station there is also a row "Total" for the city-wide result.
The political "parties" that enter into the analysis are: Vision Vancouver (VV), the Nonpartisan Alliance (NPA), the Green Party (GRN), the Coalition of Progressive Electors (COPE), and Vancouver First. In addition, for the School Board, there is Public Education Pro, and for the Park Board, there is the Cedar Party.
Methodology
The literature has employed a variety of statistical approaches to capture ballot-order bias. Because vote counts are discrete and include zero, econometric analysis favours a "count regression" rather than a simpler ordinary least squares approach. I use the SAS procedure COUNTREG in my analysis, and specifically, I employ a negative binomial regression model with a quadratic variance function. The dependent variable in my model is the vote count for a particular candidate in a particular polling station, for each of the three elections (school board, park board, city council).
There are obviously differences across polling stations and party preference, and I account for these by including indicator effects for each in the model. Count regressions have great similarity to log-linear regressions, and thus it is best to think of these fixed effects as multiplicative (explaining percentage shifts) rater than additive (explaining vote count shifts). These fixed effects absorb much of the variation in the model, and the variation that is left is what is of interest to us.
I include three regressors of interest in the model and report the outcome of the analysis in a table below. I include an incumbency indicator to identify the difference between incumbents and newcomers to an election. The key variable is called "log(Rank)" and is the logarithm of the rank number of a candidate within his or her party list. For example, the rank numbers for the Vision Vancouver candidates "Alexander", "Bacchus", "Clement", "Lombardi", "Payne", "Wong", and "Wynen" are 1 through 7. I use a logarithmic transformation as the rank order effect can be expected to diminish: the effect from the first to the second will be larger than from the sixth to the seventh candidate.
In addition, I also test the hypothesis that voters give higher preference to the first-ranked candidates regardless of party affiliation, up to the number of seats on each council. The first hypothesis is that voters give higher preference to the higher-ranked candidates of their preferred party, while the second hypothesis asks whether voters just pick whoever is at the top of the ballot no matter what they stand for.
I test two model specifications. In model "all" I have included all candidates, and in model ">1" only those candidates where more than one candidate ran for a particular party. The latter model excludes independents and parties with only one candidate. Independent candidates are rarely elected and even uninformed voters may screen them out when casting votes in alphabetical order. For that reason, the second model provides a "tighter" test for the rank-order hypothesis because it only focuses on the candidates affiliated with political parties that field multiple candidates.
I prefer the second specification because it follows a theory that claims that voters engage in "satisficing". Voters evaluate candidates as they scroll down the ballot and choose the first candidates (up to the maximum allowed) that meet their basic criteria.
Empirical Results
The table below shows the results of my analysis, and only the relevant bits; it does not show a variety of summary statistics or the fixed effects for parties and polling stations. The rows show the type of election, and for each election the two model specifications. The estimates that are reported in the table can be thought of as percentage increases similar to a log-linear regression. Estimates with a letter superscript "a", "b", or "c" are statistically significant.
Incumbency has positive effect when it is significant. The incumbency effect was strongest for the school board, where all previous trustees sought re-election. There, an incumbent could expect about a 23-24% vote premium. There were fewer incumbents running for the park board, and thus the effect there is neither strong nor significant. The incumbency effect for city council is positive and significant in the second specification (about 15%), but not in the first specification.
Alphabetical rank order within party lists matters clearly for the election of VSB trustees. The rank order effect is negative and significant. The second candidate will tend to receive about 10% fewer votes than the first candidate on the party list, everything else equal, and the fifth candidate on the party list will receive about 22% fewer votes than the first-ranked candidate.
A second test is for top-listing. Highly uninformed voters may simply mark the first X candidates, where X is the maximum number of votes permitted. For the school board, this seems to have not mattered at all. The results are not significant. It is likely that higher name recognition for the incumbents played a role. The opposite is true for the park board. Here, fewer incumbents ran for office again, and the empirical analysis picks up a strong top-listing effect. The top 7 names on the list that were affiliated with political parties gained an extra 20%. The top-listing effect may also have boosted the fortune of candidates for city council. While the first specification is a bit suspect (I will explain below), the second specification points to an 11% benefit for the ten candidates whose name came first and who were affiliated with one of the political groups in Vancouver.
| Election | Model | Incumbency | log(Rank) | Top-Listed |
|---|---|---|---|---|
| City Council | all | -0.039 (0.79) | 0.054a(2.44) | 0.579c(17.1) |
| City Council | >1 | 0.152c(3.33) | -0.053a(2.30) | 0.113a(2.25) |
| Park Board | all | 0.053 (0.96) | -0.048 (1.60) | 0.091a(2.28) |
| Park Board | >1 | 0.044 (0.80) | -0.004 (0.12) | 0.193b(3.28) |
| School Board | all | 0.228c(5.17) | -0.096b(2.64) | 0.059 (1.45) |
| School Board | >1 | 0.240c(5.42) | -0.137b(3.27) | -0.001 (0.02) |
Estimates shown are based on voting results for each candidate at each polling station. Numbers in parentheses show z scores, and the superscripts a, b, and c indicate statistical significance at the 95%, 99%, and 99.9% levels of significance, respectively.
There are some results in the above table that may be a bit quirky, perhaps. The first row with the results for all candidates for the city council has a rather strong top-listing effects, a positive rank ordering effect (contradicting the hypothesis), and an insignificant incumbency effect. There may be a problem with the model specification because one party (the NPA) had a preponderance of alphabetically high-ranked candidates while another (VV) had a preponderance of lower-ranked candidates. Thus the top-listed variable may simply capture party preference. Interestingly, the results look much more "normal" once the ballot is reduced to party-affiliated candidates.
Naturally, my empirical analysis is relatively "ad hoc" and could be refined in numerous directions. However, I think the results are relatively robust and quite consistent with what others have found.
Did alphabetical ordering change the election outcome?
As any good econometrician will tell you, there is a big difference between statisical significance and what economic significance. Something that is statisically significant has an influence, but whether this impact is big or small is a question of economic significance. The question is: if ballot order had been arranged randomly, would the election outcome have been different for parties or candidates?
I think it is likey that the ballot order mattered in the park board election because there were few incumbents, and the candidates are usually even less known than city councillors or school board trustees. Arguably, the NPA had more candidates higher up on the list than VV, and this may have given the NPA a slight advantage among uninformed voters. For the school board, the main effect is in the rank ordering within each party rather than for the overall vote share of each party. It is likely that newcomer Joy Alexander received more votes than incumbents Cherie Payne and Rob Wynen simply because the latter were further down the list. Similarly, NPA newcomers Stacy Robertson and Christopher Richardson received far fewer votes than Fraser Ballantyne, who benefited both from an incumbency advantage and alphabetical ordering. While the ordering of names may have had an impact on individual candidates who were elected or defeated, it is less likely that it would have changed the comosition of the school board. Curiously, the names of the the five city councillors with the most votes start with A, B, C, and D: Adrianne Carr, George Affleck, Elizabeth Ball, Melissa De Genova, and Heather Deal. Go figure.
Some final thoughts
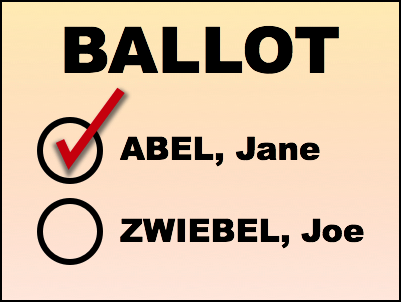
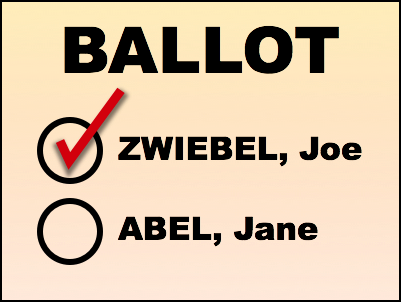
My own research, shown above, confirms the existence of the rank-order effect on ballots. Alphabetically-ranked ballots favour Jane Abel and disadvantage Joe Zwiebel. I for one should not complain should I ever feel the urge to enter politics. My family name starts with the letter "A" in the alphabet. Please vote for me!
What can cities do about rank-order effects? Is it fair to stick to alphabetical ordering? The obvious solution is some form of randomization. But presenting each voter with a unique randomized ballot could be expensive. After all, even with 29 names, there would be 29! possible permutations: that is 10 to the power of 31—an astronomical number and many more than there are voters. One could imagine a random number generator to generate batches of one-hundred identical ballots. That would not be completely random, but it would be better than no randomization at all. The practical question is how costly the printing of randomized ballots would be, and whether this would lead to a greater possibility of errors, confusion, or appearance of fraud. Imagine the protests if a random number generator produced just one batch in which all candidates from one party appeared at the top of the list. Someone would cry foul, even if it was just the random number generator and not a nefarious election official who was responsible. Implementation costs and other practicalities may be something to consider. But what is the price of electoral fairness?
There is perhaps another solution to the alphabetical ballot ordering problem: proportional representation. Instead of voting for individual candidates, voters would cast a ballot for a party, with each party list having a pre-established rank order. Whether proportional representation is easier on voters is debatable, however. It reduces choice—and that makes it both easier and harder. It makes it easier because it encourages voting by political preference rather than by individual candiates. On the other hand, it makes it harder because one is forced to make a single choice. It is no longer possible to sprinkle votes across party lines and look for candidates that one believes are the most competent. Which system is "better" depends very much on the objectives. Simplicity is perhaps one of them, but another important objective is to raise the perpetually low voter turnout in municipal elections. What is the best way to get more people to take an active interest in local affairs?
While alphabetical candidate ordering seems to matter for municipal politics, it is less likely to interfere with provincial or federal politics. There, we surely know who our favourites are, don't we? I for one look forward to casting my ballot in the next elections, and I hope you do too. Here in BC, we will probably get a chance to go back to the polling stations for a transit referendum in early 2015. Mercifully, the question will be a simple "yes" or "no".
Recent Blog Entries
- Should data centres provide demand flexibility to protect BC's electricity grid? (June 8)
- Wind power is growing in British Columbia (June 5)
- Canada needs better rail, but not high-speed rail (June 2)
- How are Canada's electric vehicle imports trending? (May 9)
- The 2026 oil shock may become larger than you think (April 30)
- Improving road safety and saving lives with Leading Pedestrian Intervals (April 2)
- Where are BC's LNG exports sailing to? (March 27)
- Driving electric has become much more beneficial (March 17)
- Today's ruling by the U.S. Supreme Court won't end Trump's trade wars (February 20)
- America's Federal Reserve must stay independent (January 13)
- What good are stablecoins? (19 Dec 25)
- Canada's alcohol imports have shifted (27 Nov 25)
Topics
Months
Subscribe to RSS feed ![]()