There are two major crude oil price indices. Brent is the major benchmark for oil extracted from the North Sea. Brent is usually regarded as the leading global price index for crude oil. In the Eastern part of Canada, oil is mostly imported and is often benchmarked in Brent. In Western Canada, oil is drawn from Canadian and US sources and is benchmarked as Western Texas Intermediate, or WTI for short. Sometimes WTI is also referred to as Cushing, the major trading hub for crude oil in Northern America. Both benchmarks are for "light sweet crude", but WTI is somewhat lighter and sweeter than Brent. As WTI is a slightly higher quality than Brent, WTI should trade at a slight quality premium over Brent. In practice, it doesn't.
As the chart below shows, Brent has been trading at a premium over WTIsince 2011. At times, this gap reached as high as $30 per barrel. By the end of 2014, the price gap seemed to have vanished, but it reappeared in early 2015. Calling the price gap a "Brent premium" is perhaps the wrong way to put it. It is more of a "WTI discount" because the price gap reflects the glut of oil available in North America since the beginning of the "shale oil" boom. The sizable price gap is one of the reasons why exporting crude oil has become a very profitable proposition for Western Canadian oil producers.
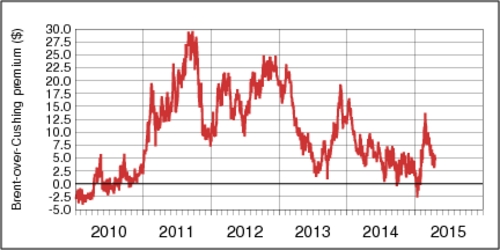
click on image for high-resolution PDF version.
The price differences between Brent and WTI raises an interesting practical question about the effect of variations in these benchmark prices on the price of regular gasoline at the pump across Canadian cities. In Western Canada, gasoline is mostly derived from crude oil produce in North America. In Eastern Canada, however, crude oil is imported from a variety of countries. According to statistics from the National Energy Board, in 2013 Canada exported about four times as much oil than it imported—but imports were 30% more expensive than imports (per barrel). Based on the geographic differences on which source of oil influences the market, one would expect prices at the pump in Alberta and British Columbia to be determined mostly by West Texas Intermediate. In Ontario, Quebec, and Atlantic Canada, there should be a greater influence of Brent. However, how large is that influence?
I have put that question to the test empirically. Weekly data on gasoline prices are readily available from Natural Resources Canada. Crude oil prices are available from the US Energy Information Administration. I use the US$ prices for crude oil, whereas prices at the pump are in Canadian Dollars. Thus the CAD/USD exchange rate is hidden in the analysis. As I had discussed in my April 1 blog, the Canadian Dollar has ever more become a petrocurrency with a strong passthrough from oil prices to the CAD/USD exchange rate. Using non-linear lest squares, I have estimated the price equation \[ \ln(p_t) = \alpha+\beta\left[(1-\nu)\ln(\mathrm{BRENT}_t)+\nu\ln(\mathrm{WTI}_t) \right]+\xi\cdot t+\epsilon \] for each city in the Natural Resources Canada database. The parameter of interest is \(0\le\nu\le1\), which captures the share of influence of WTI. When \(\nu=1\), then WTI exerts full influence, and when \(\nu=0\), then Brent exerts full influence over the price at the pump. The regression equation is in logarithmic form, and thus \(\beta\) captures a passthrough elasticity. The parameter \(\xi\) captures a time trend. So what do the results tell us?
For a number of Western cities, the estimation routine ends up in the constrained case where \(nu\) is 100%. That is not surprising. WTI is clearly the driving force here. As we are moving east, the table below shows in increasing influence of Brent. However, even in the city that seems to be influenced by Brent the least, WTI's influence remains over two-thirds. Interestingly, Brent matters the most in Southern Ontario.
Recent Blog Entries
- Should data centres provide demand flexibility to protect BC's electricity grid? (June 8)
- Wind power is growing in British Columbia (June 5)
- Canada needs better rail, but not high-speed rail (June 2)
- How are Canada's electric vehicle imports trending? (May 9)
- The 2026 oil shock may become larger than you think (April 30)
- Improving road safety and saving lives with Leading Pedestrian Intervals (April 2)
- Where are BC's LNG exports sailing to? (March 27)
- Driving electric has become much more beneficial (March 17)
- Today's ruling by the U.S. Supreme Court won't end Trump's trade wars (February 20)
- America's Federal Reserve must stay independent (January 13)
- What good are stablecoins? (19 Dec 25)
- Canada's alcohol imports have shifted (27 Nov 25)
Topics
Months
Subscribe to RSS feed ![]()