Vancouver is experiencing one of the worst drought conditions ever. For a city on the rain coast, it has not rained a lot lately. Metro Vancouver issued a stage 3 water advisory that restricts some water use and prohibits other uses. Reservoirs are well below the usual seasonal level. Even though this is not the first dry year in recorded history in Vancouver, these episodes will probably occur more frequently in the future. Climate change is knocking on our doors. We better learn how to conserve water effectively.
Over the last month, water consumption in Metro Vancouver has varied betwen about 1,200–1,700 million litres per day (MLD). Our reservoir capacity at the beginning of June usually hovers around 230–270 million cubic meters. Until the start of the rain season in November there are 160 days. With average consumption of around 1,500 MLD, that makes 240 million cubic meters in total over the five-month period. We would be getting dangerously close to depleting our reservoirs rather than ending the season with 90–200 million cubic meters to spare as usual.
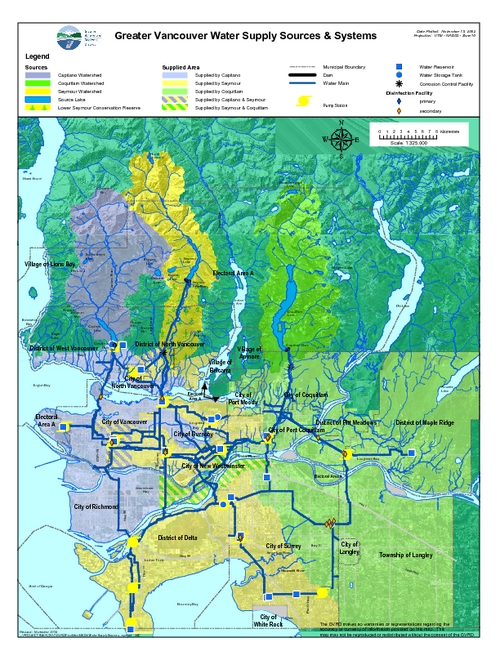
The water in Metro Vancouver comes from two main sources: about 3,500 mm of rain during the October–April rain season in the local mountains, and an accumulated 4.5 meter snow pack. Rain in the mountains is considerably larger than in the middle of Vancouver. Typical rainfall in south-central Vancouver is just 1,500 mm, and 1,200 mm at the airport. North Vancouver averages 2,500 mm per year. There are three watersheds: Capilano, Seymour and Coquitlam. The map below shows the water supply sources and systems (click on the image to view the high-resolution PDF version). It also shows which part of the city is served by which reservoir.
Metro Vancouver's 2013 Water Consumption Statistics Report sheds some light on our consumption patterns. Population growth leads to an increase in water demand, while at the same time we are making progress reducing per-capita water use. Since the late 1990s, water consumption has dropped from about 600 litres per capita per day (Lpcd) to about 470 Lpcd, a 20% drop. This has been just sufficient to compensate for the population growth, holding annual average consumption relatively steady at about 1,100 MLD. As there is no easy way to expand our reservoir capacity, future population growth needs to be compensated by continued reductions in per-capita water consumption. The water we have we must share fairly and efficiently.
Managing our limited water supply—threatened by climate change—becomes ever more important. Muncipalities are quick to impose water restrictions, but are often surprised to find that they are not very effective. Some fellow citizens blatently ignore them, and even fines do not deter irresponsible use. The city does not have enough inspectors to go around the city and check up on compliance everywhere. In my previous blog about smart water metering I had already discussed the recipe for reform. If water becomes a scarce commodity, it must be priced accordingly in order to conserve water. Pricing water use requires water metering. Cities are only slowly making progress changing from flat-rate pricing to use-pricing by the cubic meter. The retail cost of water is the sum of several components:
- the cost of capturing water in reservoirs;
- the cost for water filtration to ensure drinking-water quality (also including ozonation, chlorination, or UV treatment);
- the cost for water delivery by water mains;
- the cost for sewage collection by sewage pipes;
- the cost for sewage treatment in treatment plants;
- the overhead for administration (planning, billing, etc.); and
- the scarcity price for water.
Some of these costs are essentially fixed costs; others can be approximated by use. Some of the fixed costs for water and sewage treatment, including transportation, can also be attributed more fairly on a usage basis—heavy users pay more than light users. The scarcity price is the key element in the long run. When water supply is essentially fixed by reservoir capacity, the price of water needs to adjust to balance supply and demand.
‘Comprehensive water metering and pricing is the best answer to our water crisis.’
Metro Vancouver needs to redouble its efforts to transition the entire region from flat-rate pricing to metered pricing of water. When water prices need to be raised during drought conditions, all users need to face the same price signal. The voluntary approach to switching to metered pricing may not be sufficient—we are running out of time. Several muncipalities have voluntary programs for installing water meters free of charge, and most have bylaws that require water meters in all new single and two-family homes. The problem is that the majority of housing stock is old and still without meters, and metering in multi-family dwellings (MFDs) such as high-rise buildings is considered too costly. In the short run, flat-rate prices need to be increased significantly to entice home owners to switch to metered pricing. Once everyone is on metered pricing, the city has a powerful instrument at hand to modify behaviour during severe drought conditions. Based on a predictable schedule tied to reservoir levels or drought levels, prices should be increased during the summer and lowered when reservoir capacity has been restored. Importantly, the pricing mechanism should be transparent and predictable.
During the June-September season, the City of Vancouver adds a 25% surcharge to the usual water rate of $0.876 per cubic meter. During a drought, this is not enough to curb demand effectively. The City of Vancouver is leading the way, however. Other municipalities in the region do not employ seasonal pricing at all. One possible improvement of the City of Vancouver's pricing model would involve adding further pricing steps that are tied to the drought level announced by the province.
There remains an important obstacle for switching to water metering, especially for MFDs. Tenants and strata owners may pay water fees as part of their rent or strata fees, but many/most rental buildings and strata complexes lack individual water metering. It may be technically difficult to retrofit some of them. However, what is also missing is provincial regulation that would allow stratas to act as "internal" utilities", allowing them to meter the individual use and charge owners accordingly. The current BC Strata Property Act does not provide for this. Such secondary metering is less than ideal, though. For electricity, BC Hydro has the ability to charge owners directly even in stratas. The water utility should have the same opportunity, and it would be much easier if metering was mandatory and the metering and billing was centralized. The existing regulatory hurdles that prevent the rapid introduction of water metering for all types of homes are aggravating our water crisis. Comprehensive water metering and pricing is the best answer to our water crisis. This year is not an unusual outlier. Soon it will be the new normal.
* * *
Metro Vancouver started publishing daily water consumption data, and data is irresistable for an empirical researcher to look at. The first of the two charts below shows the daily consumption in million litres per day [MLD] since mid-June. There is actually a remarkable amount of daily variation in the data, with some days as low as 1,200 MLD and some days as high as 1,700 MLD. What explains the difference in thirst?
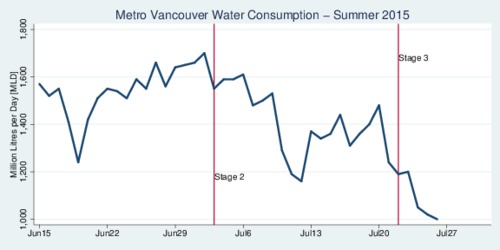
click on image to obtain high-resolution PDF version
I have tried to fit the water consumption data econometrically. The best fit is against the daily maximum temperature. As the chart below shows, every extra degree of temperature leads to an increase in water consumption of about 44 MLD. There are two research questions related to this observation: what explains this positive slope, and why is this slope as large as it is? From a policy perspective, we would like to know which measures could reduce the temperature slope.
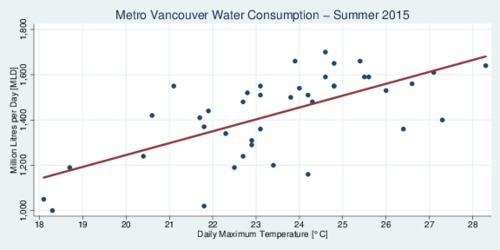
click on image to obtain high-resolution PDF version
Econometrically, the model that provided statistically significant results is one in which the consumption (in MLD) is regressed on an indicator variable for Sunday (all other weekdays are not statistically significant) and the daily maximum temperature. With a regression fit of R2 of 0.37 I find an intercept of 450.3 MLD (1.92), a Sunday effect of –122.9 MLD (2.08), and a slope for the temperature effect of 43.7 MLD (4.40). The numbers in parentheses are z-scores that indicate statistical significance. I will update this chart at the end of the summer and see if moving to stage 3 and possibly stage 4 of conservation lead to actual reductions in water use. Stay tuned.
Updated on Wednesday, July 22, 2015
Recent Blog Entries
- Should data centres provide demand flexibility to protect BC's electricity grid? (June 8)
- Wind power is growing in British Columbia (June 5)
- Canada needs better rail, but not high-speed rail (June 2)
- How are Canada's electric vehicle imports trending? (May 9)
- The 2026 oil shock may become larger than you think (April 30)
- Improving road safety and saving lives with Leading Pedestrian Intervals (April 2)
- Where are BC's LNG exports sailing to? (March 27)
- Driving electric has become much more beneficial (March 17)
- Today's ruling by the U.S. Supreme Court won't end Trump's trade wars (February 20)
- America's Federal Reserve must stay independent (January 13)
- What good are stablecoins? (19 Dec 25)
- Canada's alcohol imports have shifted (27 Nov 25)
Topics
Months
Subscribe to RSS feed ![]()