In my April 2015 blog The Canadian Petrodollar I showed the strong correlation between crude oil prices and the value of the Canadian Dollar. Since I first published the graph, I have been asked numerous times if there is an update for 2015. There is, shown below.
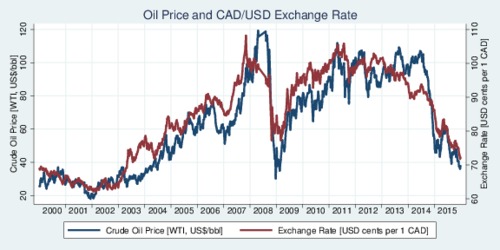
Click on the image to enlarge and view as a printable PDF file.
Statistically, the correlation remains strong. The r-square for the regression of the log exchange rate on the log crude oil price is 0.91. The estimate shows that a 10% increase in the West Texas Intermediate (WTI) crude oil prices is related to a 3% appreciation of the Canadian Dollar. The graph below is an updated version from last year's graph.
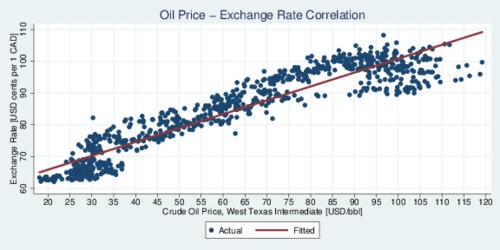
Click on the image to enlarge and view as a printable PDF file.
Perhaps it is more useful to take this graph and translate the red fitted line into a table opf exchange rate predictions. These predictions are shown in the table below, for increments of USD 1 per barrel of crude oil (West Texas Intermediate). For example, at an oil price of 55 USD per barrel, the predicted exchange rate is 82.9 US-cents per Canadian Dollar. Historically, the price of oil has not fallen below USD 20 per barrel in the previous two decades. This puts a floor underneath the USD/CAD exchange rate of about 61 cents. The historic low of the Canadian Dollar occured on January 18, 2002, with an exchange rate of almost exactly 62 US-cents. The oil price would have to drop below 21 USD per barrel to push the Canadian Dollar to break its record.
Predicted USD/CAD Exchange Rate
| USD/barrel | 20 | 21 | 22 | 23 | 24 | 25 | 26 | 27 | 28 | 29 |
|---|---|---|---|---|---|---|---|---|---|---|
| USD-¢/CAD | 61.1 | 62.0 | 62.9 | 63.7 | 64.5 | 65.3 | 66.1 | 66.9 | 67.6 | 68.3 |
| USD/barrel | 30 | 31 | 32 | 33 | 34 | 35 | 36 | 37 | 38 | 39 |
| USD-¢/CAD | 69.0 | 69.7 | 70.4 | 71.0 | 71.7 | 72.3 | 72.9 | 73.5 | 74.1 | 74.7 |
| USD/barrel | 40 | 41 | 42 | 43 | 44 | 45 | 46 | 47 | 48 | 49 |
| USD-¢/CAD | 75.3 | 75.9 | 76.4 | 77.0 | 77.5 | 78.0 | 78.5 | 79.0 | 79.5 | 80.0 |
| USD/barrel | 50 | 51 | 52 | 53 | 54 | 55 | 56 | 57 | 58 | 59 |
| USD-¢/CAD | 80.5 | 81.0 | 81.5 | 82.0 | 82.4 | 82.9 | 83.3 | 83.8 | 84.2 | 84.7 |
| USD/barrel | 60 | 61 | 62 | 63 | 64 | 65 | 66 | 67 | 68 | 69 |
| USD-¢/CAD | 85.1 | 85.5 | 85.9 | 86.3 | 86.8 | 87.2 | 87.6 | 88.0 | 88.4 | 88.8 |
| USD/barrel | 70 | 71 | 72 | 73 | 74 | 75 | 76 | 77 | 78 | 79 |
| USD-¢/CAD | 89.1 | 89.5 | 89.9 | 90.3 | 90.6 | 91.0 | 91.4 | 91.7 | 92.1 | 92.5 |
| USD/barrel | 80 | 81 | 82 | 83 | 84 | 85 | 86 | 87 | 88 | 89 |
| USD-¢/CAD | 92.8 | 93.2 | 93.5 | 93.8 | 94.2 | 94.5 | 94.8 | 95.2 | 95.5 | 95.8 |
| USD/barrel | 90 | 91 | 92 | 93 | 94 | 95 | 96 | 97 | 98 | 99 |
| USD-¢/CAD | 96.2 | 96.5 | 96.8 | 97.1 | 97.4 | 97.7 | 98.0 | 98.4 | 98.7 | 99.0 |
| USD/barrel | 100 | 101 | 102 | 103 | 104 | 105 | 106 | 107 | 108 | 109 |
| USD-¢/CAD | 99.3 | 99.6 | 99.9 | 100.2 | 100.4 | 100.7 | 101.0 | 101.3 | 101.6 | 101.9 |
| USD/barrel | 110 | 111 | 112 | 113 | 114 | 115 | 116 | 117 | 118 | 119 |
| USD-¢/CAD | 102.2 | 102.4 | 102.7 | 103.0 | 103.3 | 103.5 | 103.8 | 104.1 | 104.3 | 104.6 |
This table sheds an interesting perspective on the question about what an "ideal" oil price would be for Canada. The OECD puts our purchasing power parity (PPP) with the United States at about 82 US-cents per Canadian Dollar. If you look up 82.0 cents, you find that he corresponding price of oil is USD 53 per barrel. A higher oil price will overvalue the Canadian Dollar, and a lower oil price will undervalue the Canadian Dollar. An oil price of 53 USD per barrel is stil not happy news for Canadian oil producers, which are generally thought to need at least 60 USD per barrel to break even.
Recent Blog Entries
- Should data centres provide demand flexibility to protect BC's electricity grid? (June 8)
- Wind power is growing in British Columbia (June 5)
- Canada needs better rail, but not high-speed rail (June 2)
- How are Canada's electric vehicle imports trending? (May 9)
- The 2026 oil shock may become larger than you think (April 30)
- Improving road safety and saving lives with Leading Pedestrian Intervals (April 2)
- Where are BC's LNG exports sailing to? (March 27)
- Driving electric has become much more beneficial (March 17)
- Today's ruling by the U.S. Supreme Court won't end Trump's trade wars (February 20)
- America's Federal Reserve must stay independent (January 13)
- What good are stablecoins? (19 Dec 25)
- Canada's alcohol imports have shifted (27 Nov 25)
Topics
Months
Subscribe to RSS feed ![]()