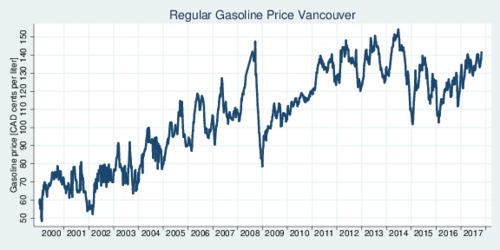
Motorists in Vancouver have noticed that gasoline prices at the pump have reached new heights in recent months. Even at the end of this year's driving season, prices have not fallen much. Even allowing for the aftermath of hurricane Harvey, which has impacted refinery capacity, the pass-through from crude oil prices to gasoline prices at the pump seems to have shifted. When oil prices crumbled at the end of 2014, gasoline prices followed. However, since 2015, the link between crude oil prices and what you pay at the pump in Vancouver has shifted fundamentally. The first graph below tracks the weekly average gasoline prices in Vancouver, climbing to over 140 cents per liter this month.
click on image for high-resolution PDF version
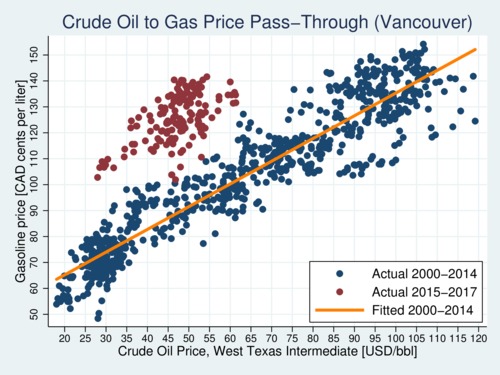
High gasoline prices are not new to Vancouverites. They peaked at over 150 cents in 2014 when crude oil prices were still in the US$100 per barrel range. In one of my previous blogs (April 11, 2015) I had pointed to the regularity of the pass-through relationship. Over the course of fifteen years, the pass-through has been remarkably predictable. That link has broken, and quite dramatically, as the next figure illustrates. The blue dotes and orange fit line show the stable link between 2000 and 2015. The red dots show the weekly pattern since 2015. There is a big jump in prices even accounting for the changes in crude oil prices. What explains this massive jump?
click on image for high-resolution PDF version
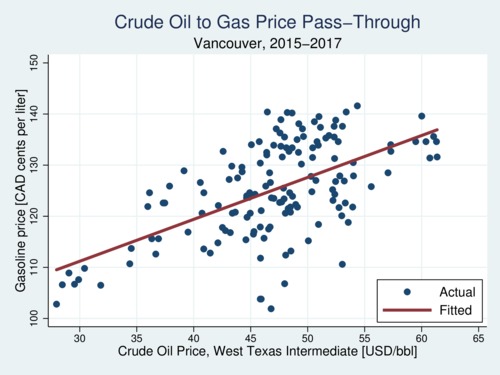
Even with the big jump in gasoline prices since 2015, the exchange rate pass-through is still working. The next figure shows the red dots in the previous graph magnified, with a new fit line for the pass-through. The fit is less tight, but it roughly corresponds to the previous version I had estimated. The all-inclusive pass-through elasticity used to be about 0.34, while it has dropped to 0.28 in the new version. The Canadian Dollar is still a petrocurrency, which means that changes in the price of crude oil shift the USD-CAD exchange rate in a rather predictable way. That link remains strong.
click on image for high-resolution PDF version
The old fit line for the 2000-2014 data suggested that a crude oil price of 50 USD per barrel translated into a 90 cent price of gasoline at the pump. Now, the same crude oil price suggests about 125 cents. That implies a 35 cents per liter. However, a few things have changed, and a careful analysis confirms that even though there is a significant bump in gasoline prices since 2014, it is a fair bit smaller than 35 cents per liter. I have adjusted my pass-through model to filter out the effect from fuel taxes, which have crept over the last two decades but have been flat since 2015. My revised model regresses the price of gasoline net of taxes on the crude price of oil (in USD per barrel), a linear time trend that captures general cost increases, and a post-2014 indicator variable that identifies the structural shift. The estimates are shown in the table below in a linear and a logarithmic version. The pass-through parameter is about 0.53 CAD cents for each US Dollar increase in crude oil prices. As it happens, the elasticity is the same number: 0.53. Each year gasoline prices increase by about 1.1 cents due to general cost inflation. Troublingly, the post-2014 indicator shows an 11-cent bump that cannot be explained. It is far less than the visual 35 cents per liter seen in the diagram, but it is still remarkable. It is as if the carbon tax in BC had been nearly doubled. What explains this post-2014 bump?
| Dependent Variable |
Gasoline Price (net of taxes, cents) |
Log of Gasoline Price, net of taxes |
|---|---|---|
| Intercept | 22.654c(39.6) | 1.870c(37.7) |
| Post-2014 Indicator | 10.987c(8.46) | 0.192c(9.12) |
| WTI Price of Crude Oil | 0.529c(34.6) | 0.529c(35.3) |
| Time Trend (years since 2000) | 1.127c(10.9) | 0.015c(8.31) |
Estimates shown are based on 926 weekly data points of retail gasoline prices in Vancouver and WTI crude oil prices (in US Dollars) for the time period 2000 through October 2017. Time trend is expressed in years since January 1, 2000. Numbers in parentheses show z-scores, and the superscripts a, b, and c indicate statistical significance at the 95%, 99%, and 99.9% levels of significance, respectively. The Post-2014 indicator is equal to one for all observations since January 1, 2015, and zero otherwise. The R-squared of both regressions are 0.89.
Selling gasoline includes five cost components: the cost of production (crude oil); the cost of refining; the cost of distribution; taxes; and mark-up (profits). Which of these five is responsible? We can rule out taxes immediately. They have staid flat in the last few years since the carbon price in B.C. leveled off at $30 per tonne of CO2 (equivalent to 6.67 cents per Liter at the pump). The new version of my regression explicitly filters out taxes (10 cents federal taxes, 25.5 cents provincial and regional charges, 6.67 cents BC carbon tax, and 5% GST on top of all). So are the oil companies drowning in extra profits? Not exactly: with oil prices in the doldrums, 2016 has been a terrible year for Canadian oil producers, and 2017 won't be much better. The outlook is far less bleak south of the border, and there has been one development that has pushed up prices since 2015.
As every economists will tell you, prices are determined by supply and demand. If the cost of crude oil is fully accounted for and taxes are stable too, then what about demand and refinery costs? In 2016 the U.S. became the world's top net exporters of fuel—the refined type, not the crude oil that remains subject to an export ban. The booming exports have bolstered the profit margins of the largest of the refineries in the United States. While the U.S. still imports large amounts of crude oil even though the shale and fracking revolution has boosted output enormously since 2005, American refineries re-export imported crude as refined gasoline, diesel, and kerosene. This increase in demand for refined product is driving up refining costs. Simply put, North American refined product has become a global product, and surging demand elsewhere in the world is having an impact on the prices you and I pay at the pump. The Trump government in Washington is working towards deregulating oil and gas production to boost U.S. exports—a political theme referred to as "energy dominance". The chart US dependence on foreign oil recedes from Thomson Reuters shows the trend. What changed in 2015 was the sudden drop in oil prices. Suddenly, the crude-to-refined products re-export play became more profitable. So if you're unhappy about high gasoline prices in Vancouver, blame rising international demand for refined products.
The cost of refining is widely captured by so-called crack spreads (see An introduction to crack spreads by the US Energy Information Administration). These are differences between wholesale petroleum product prices and crude oil prices and reflect refining margins. Crack spreads can often identify current supply conditions. The gasoline crack spread is widely used, while another common measure is the 3:2:1 crack spread, which is calculated by subtracting the price of three barrels of crude oil from the price of two barrels of gasoline and one barrel of distillate. There are also future prices of the spread, as traders can buy futures in both crude oil and gasoline simultaneously. Historically, regular gasoline crack spreads are about 5-15 USD per barrel. They are markedly up between in 2011 and 2012, and again since 2015. During 2017 they have increased again and are now around USD 20 per barrel with an expectation of future increases. The working assumption is that the increase in exports of refined products has boosted crack spreads.
So welcome to the "new normal" of gasoline prices. Based on the new model for the 2000-2017 data, gas prices in Vancouver are a little higher than expected, so in addition to the effects described above there is also a temporary price hike, likely due to the aftermath of the hurricane season and refinery capacity outages. My gasoline price pass-through diagram, first introduced in my August 25, 2015 blog "Are you paying too much at the pump in Vancouver?" will continue to be updated every weekday.
Motorists in Vancouver who aren't happy about high fuel prices should take consolation in the fact that gasoline is much more expensive in other parts of the world. Motorists in Germany pay about 200 cents per liter, and prices in Norway are even higher. If gasoline prices start to hurt, consider going electric. A typical electric vehicle requires about 20 kWh per 100 km rather than an average 10 liters per 100 km for a gasoline-engine car. At a cost of 9 cents per kWh, and driving an average 12,000 km per year, charging an EV will cost you $216. At 145 cents per liter, it will cost you $1,740 to refuel your gasoline-engine vehicle. This means that you can save about $1,500 a year driving electric. As electric vehicles are getting cheaper, it won't be long before driving electric will become the more economical choice—an a lot cleaner choice too (see also my blog are eletric vehicles always cleaner?).
Recent Blog Entries
- Should data centres provide demand flexibility to protect BC's electricity grid? (June 8)
- Wind power is growing in British Columbia (June 5)
- Canada needs better rail, but not high-speed rail (June 2)
- How are Canada's electric vehicle imports trending? (May 9)
- The 2026 oil shock may become larger than you think (April 30)
- Improving road safety and saving lives with Leading Pedestrian Intervals (April 2)
- Where are BC's LNG exports sailing to? (March 27)
- Driving electric has become much more beneficial (March 17)
- Today's ruling by the U.S. Supreme Court won't end Trump's trade wars (February 20)
- America's Federal Reserve must stay independent (January 13)
- What good are stablecoins? (19 Dec 25)
- Canada's alcohol imports have shifted (27 Nov 25)
Topics
Months
Subscribe to RSS feed ![]()