In April 2015 I asked the question: Is the Canadian Dollar a petrocurrency? The data provided a clear answer: since the turn of the century, yes. It is time to update my blog The Canadian Petrodollar as I often hear a question from colleagues, students, and journalists: has the relationship changed since the big slump in crude oil prices over the last few years? Three years later, the data still give a clear answer: the relationship between crude oil prices and the CAD-USD exchange rate remains strong.
‘Even after the oil price crash in late 2014, the Canadian dollar still remains a petrocurrency.’
Using weekly data, the diagram below traces the movement of the Canadian Dollar against the US Dollar over the last eighteen years, from 2000 to early 2018, with the red line. The blue line traces the price of oil as captured by the West Texas Intermediate (WTI) index, the key benchmark for North American oil. When scaled to match each other's movements, the relationship between the Canadian Dollar's exchange rate and the price of crude oil emerges strongly.
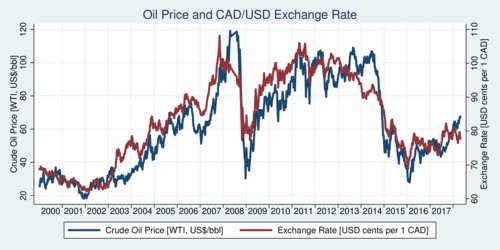
Click on the image to enlarge and view as a printable PDF file.
The next chart takes the same data and arranges it so that we can see the correlation between crude oil price and exchange rate more clearly. The red line through the data points shows the simple linear fit—a regression line with just an intercept and slope. The R-square of this regression with 937 observations is 0.85. This fit improves even further to 0.90 if one regresses the log exchange rate on the log oil price, reflecting the relative rather than absolute nature of prices, and adds a simple linear time trend. What that means is that about nine-tenth of the variation in the US-Canadian exchange rate can be explained by oil price changes.
Empirically, a one US-Dollar increase in the WTI price of crude oil translates into a 0.41 cent increase in the exchange rate (expressed in US cents per one Canadian Dollar). In the logarithmic specification, the elasticity is 0.31, which means that a 10% increase in the price of crude oil leads to a 3.1% increase in the exchange rate. The time trends is small and negative: about 0.084 cents per year. This captures mostly the effect from changes in the production cost of oil.
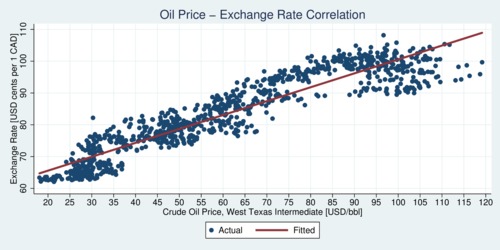
Click on the image to enlarge and view as a printable PDF file.
The large drop in the price of crude oil in late 2014 is clearly mirrored in the drop of the USD-CAD exchange rate. Now that the price of oil has started to recover—it passed USD 70 per barrel a few days ago, the exchange rate movement seems to be trailing a bit. Other economic factors play important roles as well, namely the expectations about increases in interest rates. Here, US monetary policy points to quicker tightening than in Canada, and thus there remains downward pressure on the USD-CAD exchange rate as this gap in interest rate expectations widens. However, it is rather likely that the USD-CAD exchange rate will catch up eventually, and with a price of oil at about 70, the exchange rate we should expect is about 88 US cents per Canadian Dollar. At the current rate of 78 US cents per Canadian Dollar, there is about a 10-cent gap of undervaluation of the Canadian Dollar. But remain cautious trading on such expectations: perhaps it is the price of oil that is a bit ahead of the curve, not the Canadian Dollar that is behind on the curve.
Recent Blog Entries
- Should data centres provide demand flexibility to protect BC's electricity grid? (June 8)
- Wind power is growing in British Columbia (June 5)
- Canada needs better rail, but not high-speed rail (June 2)
- How are Canada's electric vehicle imports trending? (May 9)
- The 2026 oil shock may become larger than you think (April 30)
- Improving road safety and saving lives with Leading Pedestrian Intervals (April 2)
- Where are BC's LNG exports sailing to? (March 27)
- Driving electric has become much more beneficial (March 17)
- Today's ruling by the U.S. Supreme Court won't end Trump's trade wars (February 20)
- America's Federal Reserve must stay independent (January 13)
- What good are stablecoins? (19 Dec 25)
- Canada's alcohol imports have shifted (27 Nov 25)
Topics
Months
Subscribe to RSS feed ![]()