Electricity economics differs from other branches of economics in one crucial dimension: supply and demand must match in real time, whereas in other markets there can be a substantial delay between supply and demand, and excess supply or demand are possible. With electricity, supply and demand must match near-perfectly or the system will suffer a brown-out or black-out. Thus electricity economists look a lot at demand patterns and focus even more on peak demand.
British Columbia is very fortunate that it can rely almost entirely on renewable energy, mostly hydro and a little bit of wind energy. Yet, electricity demand in BC has its own patterns and issues. For those interested in understanding electricity demand patterns in British Columbia, the charts below provide a useful overview of the most significant of them. The diagrams below are based on the last five years of hourly load data from BC Hydro, processed through an empirical estimation framework to filter out the patterns of interest.
click on image for high-resolution PDF version
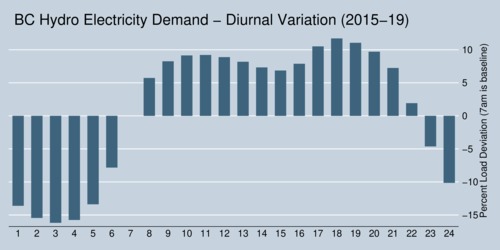
The first chart shows the diurnal pattern over the course of the twenty-four hours of each day, with the demand between 06:00 and 06:59 providing the baseline. The night hours between 10pm and 6am are characterized with low demand that reaches its minimum in the wee hours with about 15% less electricity than the base line. During the day, there is a morning peak around 8-10am and a slightly higher afternoon peak around 3-6pm, with demand about 10% above the base line. (Note that this chart uses local standard time, so the peak hours in summer are shifted by one hour because of daylight saving time. For example, the 7th hour in the chart corresponds to 7:00-7:59 during the DST period. Peaks are thus an hour later in the summer.)
click on image for high-resolution PDF version
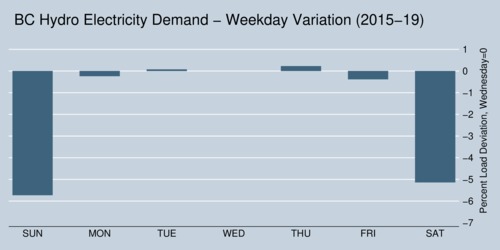
There is also a clear weekend pattern. Compared to Wednesdays, demand drops off by about 5-6% on Saturdays and Sundays—most likely an effect of lower commercial activity on weekends that is only slightly offset by higher electricity consumption by households who spend more time at home over the weekend and may be using appliances such as washing machine and laundry dryers more intensely.
click on image for high-resolution PDF version
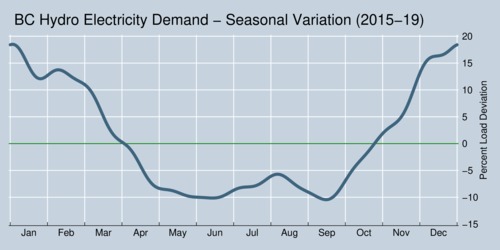
The seasonal pattern was filtered out of the data through a 12-th order fast Fourier transformation. It shows clearly that British Columbia is a "winter-peaking" jurisdiction. Demand in the winter is about 15-20% higher than average at its peak at the end of December as electricity is used for heating widely. Demand reaches low points in early June and mid-September, while the use of air conditioning equipment raises demand slightly in July and August, but not by much. At its lowest point, electricity demand is about 10% lower than average.
click on image for high-resolution PDF version
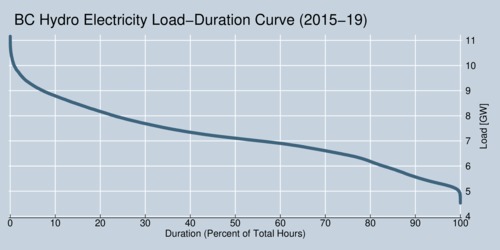
Electricity economists reorder the hours in descending order of load to generate what is known as the load-duration curve, shown above for the entire five-year period. The horizontal axis shows the percentage of duration, while the vertical axis shows the actual load in Gigawatts (GW). The curve falls quite quickly at the beginning, marking the hours where demand is exceptionally high. The curve is quite flat throughout most of the range and only turns steep again at the low-demand end where there are hours with exceptionally low demand (which can also entail power outages where demand is curtailed artificially). Electricity demand in British Columbia varies between about 5 and 11 Gigawatts. This ranges is quite wide, indicating that large fluctuations in demand over the various seasonal, week-daily and diurnal cycles. About 17/20-th of the demand is easily predicted by these cycles. The remainder is due to other influences, notably variations in the weather. Generally, electricity demand can be forecasted quite well.
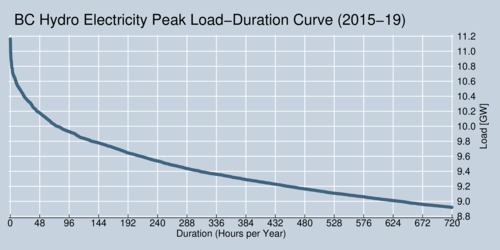
click on image for high-resolution PDF version
To further highlight the peak load issues in British Columbia, consider the first ten percent of the load-duration curve, magnified in the graph above. The horizontal axis now shows hours in a year. For a total of about 2 days a year, demand exceeds 10.2 GW. About 1 GW spare capacity is needed to satisfy this peak load, about the same as six of the Cheakamus Generating Station at Daisy Lake that Vancouverites will be familiar with from driving along the scenic Sea-to-Sky Highway and passing by Daisy Lake, near Brandywine Falls south of Whistler. The 158MW station was built in 1957. As is easily seen, peak demand is expensive because it is only needed rarely. About 2 GW capacity are only needed for roughly half of a month every year, worth about a dozen Cheakamus Generating Stations. Even with Site C Dam construction proceeding to meet future demand, BC Hydro is adding capacity at its existing dams Mica and Revelstoke. The Revelstoke Unit 6 will add another 500 MW capacity to BC's grid; unit 5 was completed in 2010. Note that this project does provide new spare capacity, but not more energy, because the reservoir capacity does not change. Using all generators at the same time simply drains the reservoir more quickly, while rain fall and snow melt replenish the reservoir during the wet season.
According to BC Hydro information, the system currently offers about 12 GW capacity in total. The three largest dams—Mica, GM Shrum, and Revelstoke—together provide nearly 8 Gigawatt capacity at maximum output. All BC Hydro dams together provide about 11.9 GW. Wind capacity remains at under 1 GW. The largest wind farm—Meikle Wind Farm near Tumbler Ridge in the Peace River region—has 179 MW nameplate capacity. Natural gas is used very little, as the Burrard Generating Station was decommissioned in 2016. Natural gas capacity is just about 500 MW and in part is used for co-generarting heat (steam) for commercial use; BC Hydro only has two small thermal plants in Fort Nelson and Prince Rupert.
BC Hydro also imports and exports electricity. There are two 500 kV (westside) and two 230 kV (eastside) lines that connect BC to the United States, and two 138 kV and one 500 kV line that connect BC to Alberta. The interties to the United States are more important: they are rated for a capacity of 3,150 MW north to south and 2,500 MW south to north, so BC can export slightly more than it can import. Trade is actually two-way because of dynamic comparative advantages, as I explain theoretically and empirically in my research paper Cross-Border Trade in Electricity. BC's ability to store energy in its large dams allows the province to export electricity when it is expensive south of the border and import it when it is cheap south of the border. The new Canada Energy Regulator (the successor of the National Energy Board) reports that BC's Powerex is responsible for the largest trades with the United States (about 84% of Canada's total electricity trade). During the first 11 months of 2019, Powerex exported about 4.5 TWh of electricity and imported about 10.7 TWh—BC was a net importer. Financially, this is a win for BC. However, US electricity is not as clean as BC electricity, and this trade deficit makes electricity consumed in BC less clean than advertised, as Sarah Cox's article explains.
In case you were wondering about how much the average household in BC consumes: just under 10 MWh. At an average cost of 11.8 cents per kWh, the average BC residential customer pays about $100 per month for electricity.
Recent Blog Entries
- Should data centres provide demand flexibility to protect BC's electricity grid? (June 8)
- Wind power is growing in British Columbia (June 5)
- Canada needs better rail, but not high-speed rail (June 2)
- How are Canada's electric vehicle imports trending? (May 9)
- The 2026 oil shock may become larger than you think (April 30)
- Improving road safety and saving lives with Leading Pedestrian Intervals (April 2)
- Where are BC's LNG exports sailing to? (March 27)
- Driving electric has become much more beneficial (March 17)
- Today's ruling by the U.S. Supreme Court won't end Trump's trade wars (February 20)
- America's Federal Reserve must stay independent (January 13)
- What good are stablecoins? (19 Dec 25)
- Canada's alcohol imports have shifted (27 Nov 25)
Topics
Months
Subscribe to RSS feed ![]()