While teaching international business to students at UBC, one of the question that I am often asked is simply about who Canada trades with, and what Canada imports and exports. Visualizing this information is always the best way to commuicate the proportions of trade partners and traded products. The World Bank has a great tool for this: the WITS Integrated Trade Solution country analysis visualizer. Below I show the charts for Canada's trade profile in 2018. Click on the images to see the full-scale version and read the text more clearly.
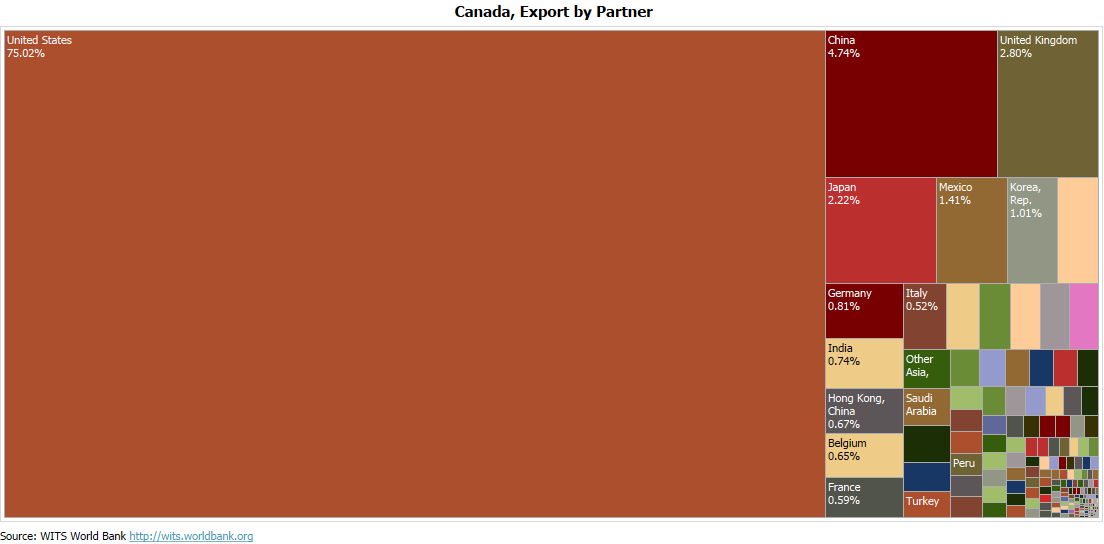
The first chart shows Canada's export partners. Three quarters of our exports goes to the United States. Our second biggest export destination is China and Hong Kong (together 5.4%). Other notable destinations in Asia are Japan (2.2%) and South Korea (1.%). The United Kingdom is our third largest trading partner (2.8%), although exports to European Union countries summed up is larger. The chart shows that other desintations are quite small in volume.
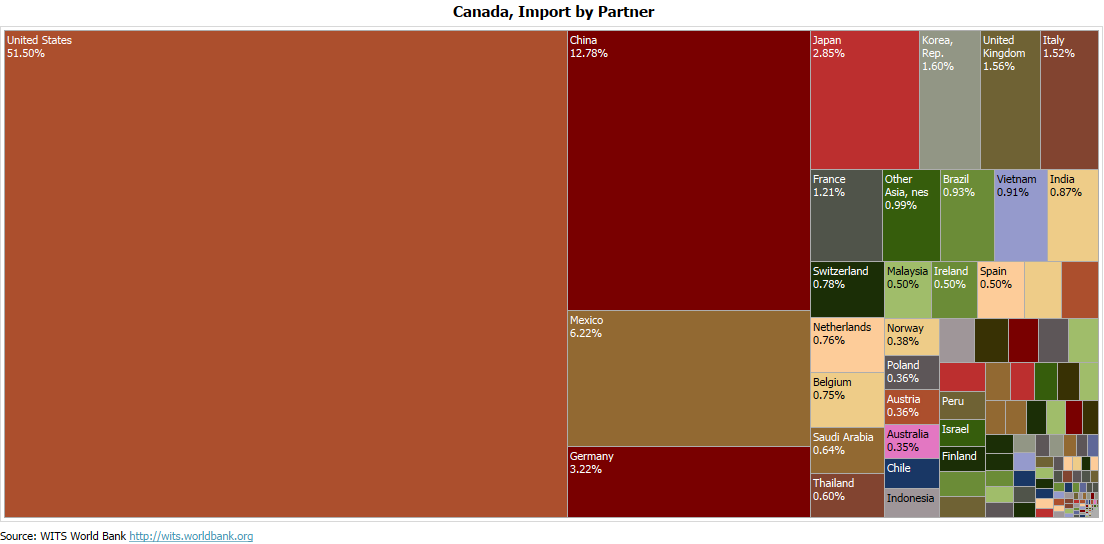
As is true for most countries, Canada's import partner profile is much more diservified. Imports from the US still dominate (they account for roughly half of the total), but imports from other origin countries show up prominently: China (12.8%), Mexico (6.2%), Japan (2.9%), and numerous European Union countries and Great Britain. Comparing the export and import partner charts, it is also quite obvious that Canada runs a trade surplus with the United States and a trade deficit with China and many other countries.
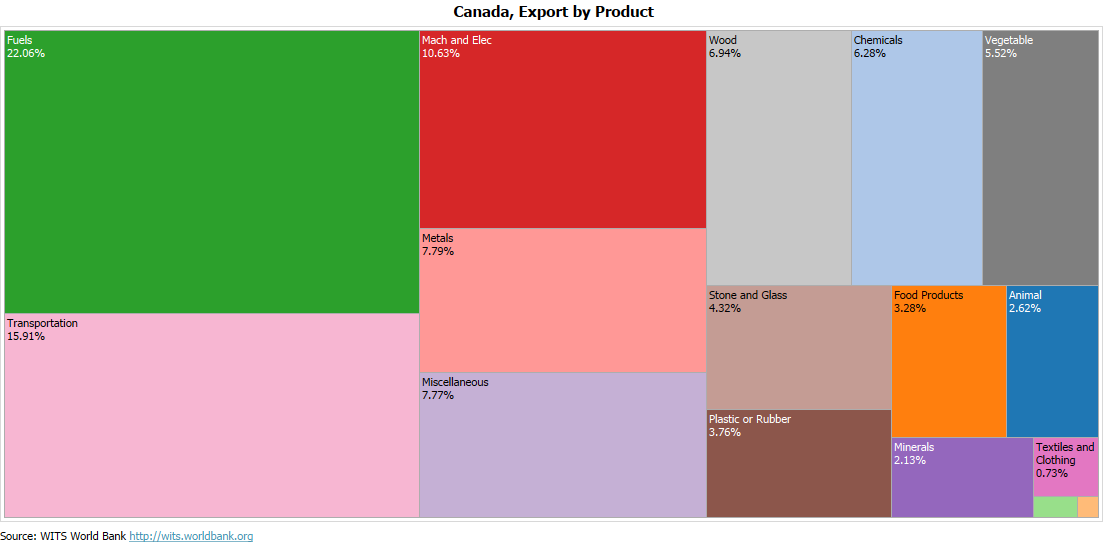
On the goods side, Canada's export profile is dominated by fuel, minerals and metals, and forestry and and agricultural products. Manufactured goods are dominated by transportation goods (mostly automobiles), machinery and electrical goods, and chemical and petro-chemical goods. Nevertheless, Canada is crucially dependent on its resource sector for generating its export income.
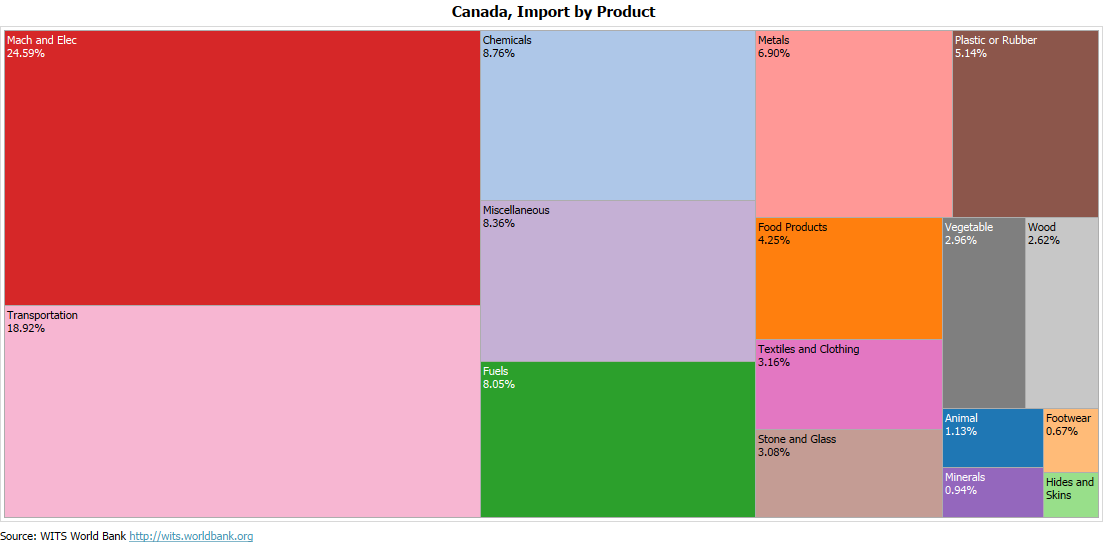
Imports broadly reflect the diversity of goods that Canadians consume. It also shows that much of our trade is two-way in nature: we export and import in the same industry. We export and import in the transportation sector, revealing the close integration of the auto manufactuers across the Canada-US border. Canada also imports fuels, primarily oil. While Canada is a net oil exporter, oil produced in Alberta is mostly exported, while oil demand in Eastern Canada is mostly satisifed by imports. Two-way trade is visible in other industries as well, revealing a high degree of product diversification and specialization across countries.
Canada is a small open economy. International trade matters more to Canada than many others. By comparison, the United States has a much lesser trade intensity. As Canada is about to ratify the new Canada-US-Mexico Agreement, the charts above highlight again the singular importance of the Canada-US trade relationship. Bill C-4, the CUSMA Implementation Act, is now before Parliament and is passed First Reading with 290-28 votes. It is fully expected that CUSMA will pass through Parliament with multi-party support.
Recent Blog Entries
- Should data centres provide demand flexibility to protect BC's electricity grid? (June 8)
- Wind power is growing in British Columbia (June 5)
- Canada needs better rail, but not high-speed rail (June 2)
- How are Canada's electric vehicle imports trending? (May 9)
- The 2026 oil shock may become larger than you think (April 30)
- Improving road safety and saving lives with Leading Pedestrian Intervals (April 2)
- Where are BC's LNG exports sailing to? (March 27)
- Driving electric has become much more beneficial (March 17)
- Today's ruling by the U.S. Supreme Court won't end Trump's trade wars (February 20)
- America's Federal Reserve must stay independent (January 13)
- What good are stablecoins? (19 Dec 25)
- Canada's alcohol imports have shifted (27 Nov 25)
Topics
Months
Subscribe to RSS feed ![]()