Population density is a hugely important variable in many economic analyses. Yet, empirical work is often very cavalier about measuring it. Simple population density is a rather flawed measure when dealing with large geographic entities such as provinces, states, and countries. The simple measure of population density is population divided by area (more more specifically, land area). However, this measure ignores the fact that most people live in cities. As an economic measure, population density needs to accommodate the fact that most economic agents live much more concentrated in space than simple population density measures suggest. We can do better with a little bit of econometric work. Enter the notion of a population-weighted population density measure. A recent working paper by John Ottensmann from Indiana University/Purdue University makes this point in much greater detail, and I would like to reemphasize the point by showing an important example—the population density of U.S. states.
Population-weighted population density actually introduces two modifications. The first is to weight the individual cells within a geographic area by population size. The second is to use the geometric rather than arithmetic mean. In the case of the United States, I have taken population estimates for 2019 from the U.S. Bureau of Census and combined it with land area data (as provided by the 2010 census). For each U.S. county \(i\) we have population \(P_i\) and land area \(A_i\). Then the population density \(\Phi_i\) is \[\Phi_i=\exp\left[\frac{1}{P}\sum_i P_i\cdot \ln\left(\frac{P_i}{A_i}\right)\right] \quad\mathrm{with}\quad P\equiv\sum_i P_i\] The results of the analysis for each state are shown in the table below. It may be more intuitive to discuss the results in a diagram that shows simple population density on the horizontal axis and weighted population density on the vertical axis. Both axes are scaled logarithmically. Click on the image to see a high-resolution version.
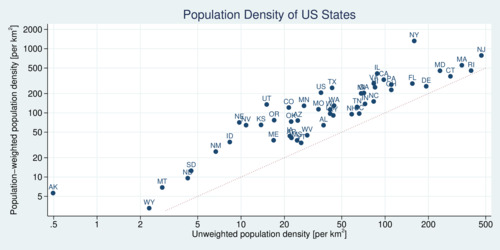
click on image for high-resolution PDF version
Every single state in the U.S. has a higher weighted population density than simple density. All points in the scatter plot lie above the 1:1 line. The differences are huge. Consider the U.S. overall. The simple population density puts 36 people on each square kilometer. That would make the U.S. a very rural place, which is of course far from what the U.S. looks like. The population-weighted numbers is almost six times as larger: 206 people per square kilometer. For some states the difference are much larger. Alaska's small population spread over the entire size of the state gives it a puny 0.5 people per square kilometer. But even in Alaska most people live in cities, and the population-weighted density is 5.6—about 11 times larger.
One state stands out the most: New York. The simple population density of 159 people per square kilometer entirely misses the fact that population is concentrated enormously in New York City. The revised population density for New York is 1,323 people per square kilometer, making New York the densest state in all of the U.S. If instead one relies on the simple measure of population density one misses the exceptionalism of New York as the urban metropolis of the United States. And even spacious Texas is much, much denser than simple measures suggest.
| State | Code | Popu-lation [million] |
Land Area [1000 km2] |
Population Density [per km2] | Difference [%] |
|
|---|---|---|---|---|---|---|
| simple | weighted | |||||
| United States | 328.240 | 9147.593 | 35.883 | 206.346 | 475.1% | |
| Alabama | AL | 4.903 | 131.171 | 37.380 | 64.194 | 71.7% |
| Alaska | AK | 0.732 | 1477.953 | 0.495 | 5.625 | 1036.4% |
| Arizona | AZ | 7.279 | 294.207 | 24.740 | 76.011 | 207.2% |
| Arkansas | AR | 3.018 | 134.771 | 22.392 | 40.781 | 82.1% |
| California | CA | 39.512 | 403.466 | 97.932 | 329.123 | 236.1% |
| Colorado | CO | 5.759 | 268.431 | 21.453 | 121.156 | 464.7% |
| Connecticut | CT | 3.565 | 12.542 | 284.276 | 371.439 | 30.7% |
| Delaware | DE | 0.974 | 5.047 | 192.951 | 259.754 | 34.6% |
| Florida | FL | 21.478 | 138.887 | 154.641 | 286.392 | 85.2% |
| Georgia | GA | 10.617 | 148.959 | 71.277 | 204.405 | 186.8% |
| Hawaii | HI | 1.416 | 16.635 | 85.116 | 250.577 | 194.4% |
| Idaho | ID | 1.787 | 214.045 | 8.349 | 35.138 | 320.9% |
| Illinois | IL | 12.672 | 143.793 | 88.125 | 410.564 | 365.9% |
| Indiana | IN | 6.732 | 92.789 | 72.554 | 138.052 | 90.3% |
| Iowa | IA | 3.155 | 144.669 | 21.809 | 43.676 | 100.3% |
| Kansas | KS | 2.913 | 211.754 | 13.758 | 64.891 | 371.7% |
| Kentucky | KY | 4.468 | 102.269 | 43.685 | 91.305 | 109.0% |
| Louisiana | LA | 4.649 | 111.898 | 41.545 | 97.165 | 133.9% |
| Maine | ME | 1.344 | 79.883 | 16.827 | 37.415 | 122.3% |
| Maryland | MD | 6.046 | 25.142 | 240.465 | 453.378 | 88.5% |
| Massachusetts | MA | 6.893 | 20.202 | 341.178 | 552.354 | 61.9% |
| Michigan | MI | 9.987 | 146.435 | 68.200 | 201.263 | 195.1% |
| Minnesota | MN | 5.640 | 206.232 | 27.346 | 128.880 | 371.3% |
| Mississippi | MS | 2.976 | 121.531 | 24.489 | 37.282 | 52.2% |
| Missouri | MO | 6.137 | 178.040 | 34.472 | 113.870 | 230.3% |
| Montana | MT | 1.069 | 376.962 | 2.835 | 6.875 | 142.5% |
| Nebraska | NE | 1.934 | 198.974 | 9.722 | 70.961 | 629.9% |
| Nevada | NV | 3.080 | 284.332 | 10.833 | 64.351 | 494.0% |
| New Hampshire | NH | 1.360 | 23.187 | 58.640 | 95.416 | 62.7% |
| New Jersey | NJ | 8.882 | 19.047 | 466.322 | 785.426 | 68.4% |
| New Mexico | NM | 2.097 | 314.161 | 6.674 | 24.910 | 273.2% |
| New York | NY | 19.454 | 122.057 | 159.381 | 1322.99 | 730.1% |
| North Carolina | NC | 10.488 | 125.920 | 83.292 | 150.632 | 80.8% |
| North Dakota | ND | 0.762 | 178.711 | 4.264 | 9.608 | 125.3% |
| Ohio | OH | 11.689 | 105.829 | 110.453 | 228.178 | 106.6% |
| Oklahoma | OK | 3.957 | 177.660 | 22.273 | 73.170 | 228.5% |
| Oregon | OR | 4.218 | 248.608 | 16.965 | 76.903 | 353.3% |
| Pennsylvania | PA | 12.802 | 115.883 | 110.473 | 275.998 | 149.8% |
| Rhode Island | RI | 1.059 | 2.678 | 395.645 | 455.294 | 15.1% |
| South Carolina | SC | 5.149 | 77.857 | 66.131 | 97.514 | 47.5% |
| South Dakota | SD | 0.885 | 196.350 | 4.506 | 12.533 | 178.2% |
| Tennessee | TN | 6.829 | 106.798 | 63.945 | 123.679 | 93.4% |
| Texas | TX | 28.996 | 676.587 | 42.856 | 245.431 | 472.7% |
| Utah | UT | 3.206 | 212.818 | 15.064 | 135.237 | 797.7% |
| Vermont | VT | 0.624 | 23.871 | 26.140 | 34.090 | 30.4% |
| Virginia | VA | 8.536 | 102.279 | 83.453 | 286.827 | 243.7% |
| Washington | WA | 7.615 | 172.119 | 44.242 | 129.547 | 192.8% |
| West Virginia | WV | 1.792 | 62.259 | 28.785 | 44.760 | 55.5% |
| Wisconsin | WI | 5.822 | 140.268 | 41.509 | 112.485 | 171.0% |
| Wyoming | WY | 0.579 | 251.470 | 2.302 | 3.270 | 42.1% |
Readers in the United States please take note the use of metric measures. The use of imperial measures is strongly deprecated in the scientific community. However, if you prefer expressing population densities in square miles, divide the square kilometer numbers by 2.59.
It matter which density measure one uses for empirical work. Even though the correlation of the logarithms of the two density measures is 0.91 (or 0.71 without logarithms), the population-weighted measure shifts the rank order of states in important places. If empirical work tries to capture a notion of economic density by way of population density, it is essential to allow for the degree of urbanization of states. Nevertheless, simply using unweighted population density and the urbanization share of states is not sufficient to capture the true density effect because cities vary dramatically in density as well.
If you use population density in any of your research, abandon simple density and embrace population-weighted density. It is not difficult to compute and it is much superior. The U.S. Census Bureau has embraced population-weighted density measures as well (see the report below.)
In the analysis above I used census data from counties. Of course, even better would be to use census tracts (there are more than 73,000) instead of counties (3,143). The measure of population density would be even better with smaller cells.
Further readings and information sources:
- John R. Ottensmann: On Population-Weighted Density, February 20128, SSRN Working Paper
- Steven G. Wilson et al.: Patterns of Metropolitan and Micropolitan Population Change: 2000 to 2010, U.S. Census Bureau, September 2012.
Recent Blog Entries
- Should data centres provide demand flexibility to protect BC's electricity grid? (June 8)
- Wind power is growing in British Columbia (June 5)
- Canada needs better rail, but not high-speed rail (June 2)
- How are Canada's electric vehicle imports trending? (May 9)
- The 2026 oil shock may become larger than you think (April 30)
- Improving road safety and saving lives with Leading Pedestrian Intervals (April 2)
- Where are BC's LNG exports sailing to? (March 27)
- Driving electric has become much more beneficial (March 17)
- Today's ruling by the U.S. Supreme Court won't end Trump's trade wars (February 20)
- America's Federal Reserve must stay independent (January 13)
- What good are stablecoins? (19 Dec 25)
- Canada's alcohol imports have shifted (27 Nov 25)
Topics
Months
Subscribe to RSS feed ![]()