On August 19, 2020, Apple became the first U.S. company to reach a $2 trillion market cap, doubling its valuation in just over two years. As the pandemic conditions continue around the world, information technology companies have gained and have been seen as a relatively safe haven. As Jack Nicas reported in the New York Times, It took Apple 42 years to reach $1 trillion in value [and] just two more years to get to $2 trillion. The market value of tech companies — Apple, Microsoft, Amazon, Alphabet and Facebook — has soared. This leads to the question what we know about the historic market concentration of the S&P-500 index, which many investors hold through Exchange Traded Funds (ETFs). Has the S&P-500 become more concentrated over the years?
To answer this question I have looked at monthly stock price data and market valuations between 1990 and 2019. (UBC's subscription to CRSP data doesn't cover the most recent months, unfortunately.) I have calculated three measures of concentrations. The Gini coefficient is the most widely used measure of concentration in the economics literature, with 0 indicating perfect equality and 1 indicating perfect concentration. It turns out that the S&P-500 is highly concentrated, much more so than income in the United States, for example. In other words, the S&-500 index is quite top heavy. How has it evolved over time is shown in the graph below.
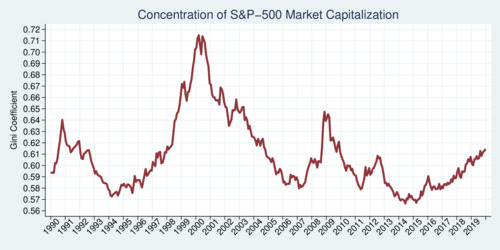
click on image for high resolution PDF version
The concentration at the end of 2019 was just over 0.61. That was higher than in 2014, but not as high as it has been during the height of the e-commerce bubble around 2000 when the Gini coefficient reached an all-time high of about 0.71. Concentration probably adds a certain amount of risk especially when the top companies are in a single economic sector. During the financial crisis in 2008/9, market concentration peaked for a second time, easing considerably in the immediate years following the Great Recession. It is an interesting research question what determines the shifts in concentration over time. There are a number of competing hypotheses. Are larger firms considered safer during a crisis? Are more profitable companies buying back more of their own shares, thus boosting their stock price? Are there shifts in investor behaviour that favour momentum? I don't have the answers to these questions, but Finance researchers probably have some answers.
I have looked at two other concentration measures: the market capitalization share of the top five and top 10 stocks in the S&P-500. The movement of these two measures is shown in the next diagram. The blue line shows the market cap share of the top 10 stocks, and the red line shows the market cap share of the top 5 stocks.
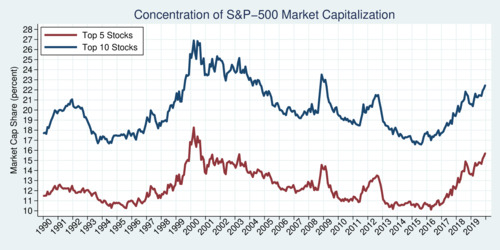
click on image for high resolution PDF version
The top five companies can account for as little as just over 10% of the total market capitalization of the S&500, and as much as 18 percent. Again, the peak occurred around 2000 during the height of the e-commerce bubble. The trends in the last three years have been rather interesting. Concentration reached a low point in 2015, but has crept up since. By the end of 2019, the top five stocks increased their share from about 10% to about 16%, while the top ten stocks increased their share from about 17% to about 22%. Note that the gap between the top five and top 10 stocks does not seem to vary all that much. This means that much of the action in terms of changing concentration is driven by the handful of companies with the highest market capitalization. This in turn appears to be driven by the market's excitement about these tech companies. However, whether this is exuberance about the future earnings potential of these firms or this sector, or some other explanation, remains a question for asset pricing researchers.
The bottom line: stocks are not generally more concentrated today than they have been in the past. Since 2000, concentration has mostly fallen. Only since 2015 have concentrations risen again, mostly along with euphoric market valuations of the leading tech companies.
Once I have the CRSP data for 2020—some time in 2021—I will update the charts shown here. It will be interesting to see how market concentration has fared during the pandemic.
Recent Blog Entries
- Should data centres provide demand flexibility to protect BC's electricity grid? (June 8)
- Wind power is growing in British Columbia (June 5)
- Canada needs better rail, but not high-speed rail (June 2)
- How are Canada's electric vehicle imports trending? (May 9)
- The 2026 oil shock may become larger than you think (April 30)
- Improving road safety and saving lives with Leading Pedestrian Intervals (April 2)
- Where are BC's LNG exports sailing to? (March 27)
- Driving electric has become much more beneficial (March 17)
- Today's ruling by the U.S. Supreme Court won't end Trump's trade wars (February 20)
- America's Federal Reserve must stay independent (January 13)
- What good are stablecoins? (19 Dec 25)
- Canada's alcohol imports have shifted (27 Nov 25)
Topics
Months
Subscribe to RSS feed ![]()