Germany's energy sector is much in the news these days because of the difficulties of procuring natural gas as Russia's politically-motivated curtailment of gas supplies has driven up wholesale natural gas prices that are peaking at €200/MWh. A shortfall in natural gas will also impact the electricity sector. Nevertheless, it is likely that voluntary conservation measures combined with increased supply from coal-fired power plants—and perhaps extending the life of one more more of the nuclear reactors that were originally scheduled to be shut down at the end of 2022—will suffice to secure electricity generation even during a colder-than-usual winter. If the winter is mild, the problems for the electricity sector appear much less problematic. Germany is working hard to fill up all of its natural gas storage facilities, hoping to reach a 95% fill level on November 1st, 2022. Germany's network operator (Bundesnetzagentur) is tracking progress. Natural gas supplies are prioritized for households, but if prices are passed on to consumers, some will switch to using electricity instead. This in turn would drive up electricity demand and could put more stress on the electricity grid. In any case, Germany's industries are already preparing to reduce gas consumption, and previously unthinkable options are back in discussion to replace Russian gas. What is clear is that Germany will be moving towards greater energy independence and larger diversification of imports.
The current energy woes are very likely accelerating Germany's transition towards more renewable energy, even if in the short run the country will need to rely on fossil fuels to bridge the gap. Looking closer at the transition that has already been under way reveals some interesting lessons that will also be of interest to other jurisdictions.
The chart below shows Germany's electricity profile over the last three years, from July 2020 to June 2022. There are twelve different generation types identified in the chart, roughly stacked by increasing volatility or intermittency. Baseload from hydro power, nuclear power, and biomass facilities shows little variation. The shut-down of nuclear power plants at the end of 2021 stands out in the chart. The remaining reactors were originally mandated to be shut down at the end of 2022, but there are active discussions to extend the life of at least one of these reactors for some time due to the current situation. Overall, Germany's hasty exit from nuclear power has left Germany relying on a hefty share of power from hard coal, soft coal, and natural gas (shown in the chart as the black, brown, and gray bars). The diagram also shows the variability of renewable energy. Solar output is obviously highly seasonal and peaks in the summer. Wind power tends to peak in the fall, and in February 2022 Germany saw a record output from onshore wind installations.
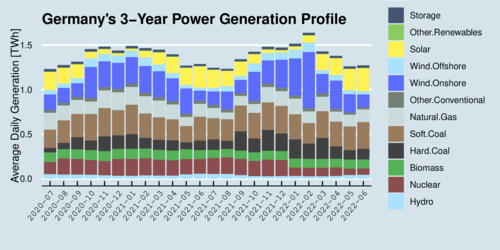
click on image for high-resolution PDF version
Overall, Germany consumes about 1.4 Terawatthours [TWh] per day, which translates into an operational capacity of between 50 and 80 Gigawatts [GW].
The next chart shows the same profile as before, but with total generation converted to percentage shares. It eliminates the seasonal variation and makes it easier to identify the contribution shares of the renewables. The seasonality of solar output is relatively predictable, while wind power fluctuates somewhat less predictably.
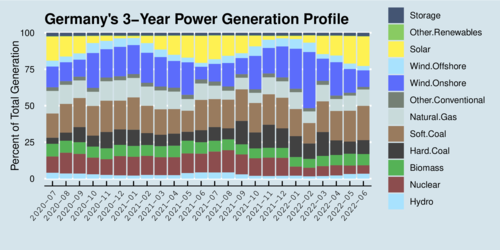
click on image for high-resolution PDF version
It is very useful to look deeper into the diurnal cycle during a typical winter day and a typical summer day. The next two charts illustrate power supply during 15-minute intervals.
January 5, 2022 neatly shows how baseload from conventional sources remain nearly constant at about 30 GW. The remaining supply is filled by wind power, most of it from onshore sources, which conveniently was also stronger during the day than the night. Solar output was quite marginal.
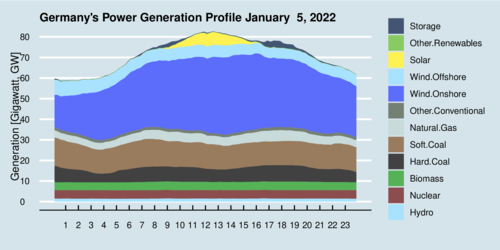
click on image for high-resolution PDF version
June 30, 2022 looked starkly different. Again, output from base load facilities including the coal power plants remained rather steady. Natural gas plants provided some of the buffering of the intermittent sources. Wind output was rather low during the day but increased during the night, which was fortuitous because solar output drops off. Nevertheless, the top level above solar indicates stored electricity flowing back into the grid, mostly from (rooftop) solar power stored in batteries. Electricity storage is beginning to become a noticeable feature of power supply in Germany.
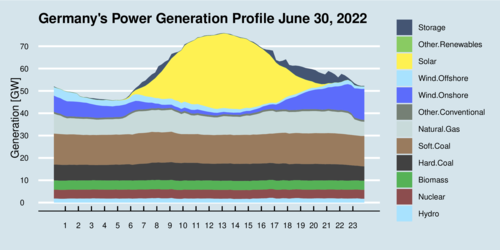
click on image for high-resolution PDF version
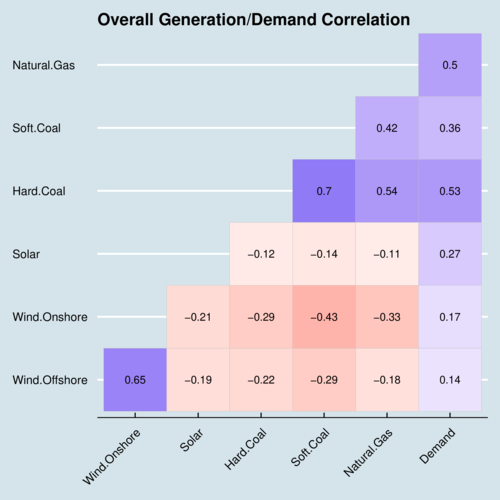
So what are the general lessons we can draw from Germany's experience for the introduction of renewable energy? For this purpose it is useful to look at the correlation structure of the three main renewable sources, solar, onshore wind and offshore wind; the three main fossil fuel power sources hard coal, soft coal, and natural gas; and electricity demand. The correlation matrix below shows the 21 correlation coefficients in matrix form. Positive correlations are shown in blueish hues, and negative correlations are shown in reddish hues.
click on image for high-resolution PDF version
Let's start at the very right with the correlation of Demand against the six different generation types. All six correlations are positive. This is not surprising for fossil fuel generators, as they follow demand. The positive correlation of intermittent renewable energy sources needs explaining, however. Solar power has the largest positive correlation, as demand is higher during daytime than at night, and solar output peaks mid-day. But even wind has a slight positive correlation. The stronger the correlation, the less we need backup power. Offshore and onshore wind also reveal a degree of complementarity as their correlation is less than perfect. Wind farms are scattered across the country, from offshore facilities on Germany's coast to onshore facilities in Germany's south. There is benefit in geographic diversification.
We also need to pay attention to the correlation structure of renewable energy sources with fossil fuel generators. One should displace the other. Onshore wind exhibits the strongest displacement effect, with a correlation coefficient of –0.43 for soft coal. This displacement is higher than for natural gas, which is usually most suited to provide backup for intermittent power sources because natural gas plants can be ramped up or down more quickly.
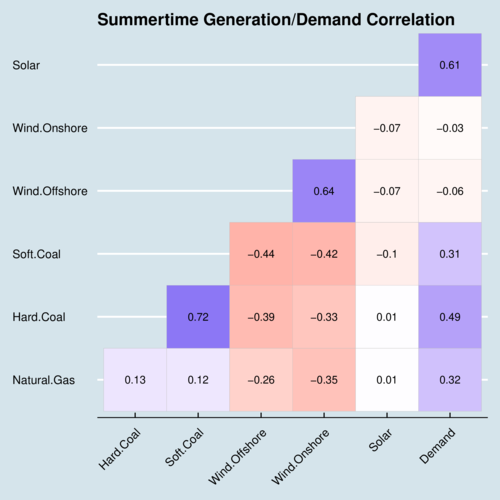
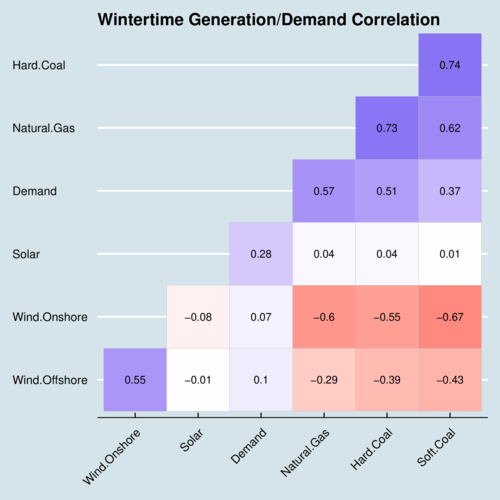
The overall correlation structure hides important seasonal differences, which are illustrated in the next two correlation matrices. The first depicts the summertime pattern during the months of June, July, August, and the second depicts the wintertime patter during the months of December, January, and February.
click on image for high-resolution PDF version
Turning to the summertime pattern, we see that onshore and offshore continue to displace fossil fuels, but not solar power. Solar power is rather uncorrelated with all other generation types, but hit has a very high correlation with demand (0.61). This means that solar power shaves off the "summer peak" in diurnal demand, as the diagram for the June 30 power profile illustrates.
click on image for high-resolution PDF version
The wintertime pattern looks yet again quite different. The top right corner of the diagram shows how fossil fuel generators follow demand during the cold season. Solar output is quite marginal during this time of year, but still remains weakly correlated with demand. During the winter, onshore and offshore wind exhibit strong displacement of fossil fuels. The more wind, the less coal. The correlation coefficient for onshore wind and soft coal reaches –0.67.
Germany has reached a point where renewable energy is essentially able to shave off the summer daytime peak. The next steps will be more difficult. Expanding wind production faces challenges in some locations, even though sufficient land remains available to build at least another 100–GW of capacity. Significant expansion is projected to come from solar power, but to reach the lofty goals of producing 80% of electricity from renewable sources by 2030, Germany would need to triple its current annual rate of capacity additions from about 5 GW to 15 GW. But there is a catch: solar power needs backup. To displace fossil fuel backup, Germany needs significant amounts of grid-scale electricity storage, either through battery capacity or through reliance on hydrogen as an energy carrier. Watch out for Germany's ambitious national hydrogen strategy to support this effort. The missing piece in the renewable energy transition scenario is effective (long-term) energy storage. In a world where energy security matters more than only a year ago, energy storage has taken on strategic importance. Germany is learning this lesson the hard way, but the result will be transformative.
Recent Blog Entries
- Should data centres provide demand flexibility to protect BC's electricity grid? (June 8)
- Wind power is growing in British Columbia (June 5)
- Canada needs better rail, but not high-speed rail (June 2)
- How are Canada's electric vehicle imports trending? (May 9)
- The 2026 oil shock may become larger than you think (April 30)
- Improving road safety and saving lives with Leading Pedestrian Intervals (April 2)
- Where are BC's LNG exports sailing to? (March 27)
- Driving electric has become much more beneficial (March 17)
- Today's ruling by the U.S. Supreme Court won't end Trump's trade wars (February 20)
- America's Federal Reserve must stay independent (January 13)
- What good are stablecoins? (19 Dec 25)
- Canada's alcohol imports have shifted (27 Nov 25)
Topics
Months
Subscribe to RSS feed ![]()