In a recent article, The Economist asked the question: Could the EV boom run out of juice before it really gets going?. Innovation and scaling-up of production are bringing down the cost of EV batteries, but the price of battery materials including lithium and nickel have been spiking. This could slow down the availability and expected cost reductions for electric vehicles (EVs). If the cost of EV batteries is not coming down quicker, will it spell trouble for the much-needed electrification of mobility to reduce carbon emissions? Perhaps not. Much overlooked is the possibility that plug-in hybrid electric vehicles (PHEVs) can bridge the gap transitioning away from internal combustion engine (ICE) vehicles. But when exactly are PHEVs superior to either ICEs or BEVs, given that they require two instead of one engine?
To explore this question, I have made a few calculations based on cost assumptions for British Columbia, simulating the vehicle choice decision over a range of gas prices (1.5 to 2.5 $/L) and battery prices ($100 to $200 per kWh). All prices are in Canadian Dollars. The exact calculations are shown below in the attached R code so that readers (and my students in particular) can replicate and extend the results. It turns out that the results are sensitive to numerous assumptions. Overall, PHEVs emerge as a reasonable alternative for a range of parameters.
My calculations are calibrated for a motorist who owns the vehicle for 10 years and drives 14,600 km per year (i.e., exactly 40 km per day). The choice is between an ICE vehicle with 7.5 L/100km fuel economy, a PHEV with a 15 kWh battery, and a BEV with a 75 kWh battery. The two electric vehicles require 25 kWh per 100km, which makes allowances for using a vehicle under typical conditions including heating during winter and cooling during summer. Electricity is fixed to cost 15 cents per kWh. Energy costs are discounted at 5%. The drivetrain for an ICE is estimated to cost $5.5K, while an electric drivetrain costs $3.2K. Buying and installing an EV charger is estimated to cost $3.5K, allowing for less than perfect locations.
A PHEV driver is assumed to drive electric when possible and turn to the gasoline engine only when the daily trip length exceeds the PHEV range. The daily trip length is modeled as a log-normal distribution with the average daily trip length as 1/365-th the annual kilometrage, along with a coefficient of variation of 0.8. That means the observed standard deviation for a 40km average daily trip length is 32km. From this we can calculate the percentage that a driver's daily trip does not exceed the PHEV' range (calculated as 54km). Based on the assumed numbers, the PHEV's electric share is 78%.
The first chart below shows the vehicle choice without any subsidies, but allowing for the $3.5K cost of an Electric Vehicle Charger (EVC) installation. The result: ICEs still dominate the picture unless gasoline prices climb above $2/L.
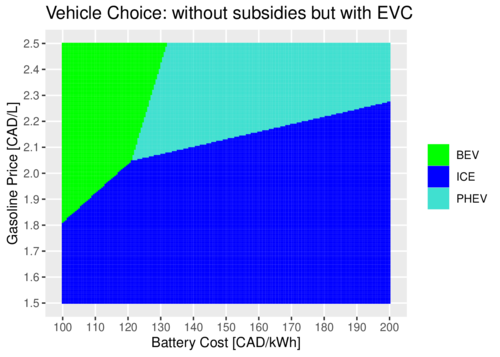
click on image for high-resolution PDF version
Now take the EVC out of the picture, lowering the gap between the vehicle choices by $3.5K. Now PHEVs dominate the picture, pushing ICE vehicles almost completely out of the picture. BEVs dominate when the battery cost falls below $120/kWh. Today's batteries cost around $180 per kWh (in Canadian currency), but with significant cost reductions still expected.
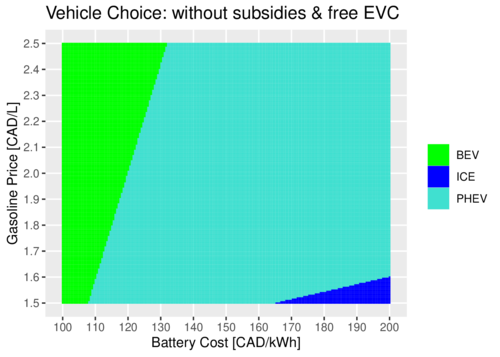
click on image for high-resolution PDF version
The above calculations ignore that there are federal and provincial incentives for purchasing EVs and installing EVCs. In the next chart I allow for $5K in subsidies for BEVs, half that amount for PHEVs, and a 50% cost reduction for EVCs. These subsidies shift the picture much in favour of BEVs, with PHEVs remaining a good choice when fuel prices are above $1.8/L and battery costs stay above $180/kWh.
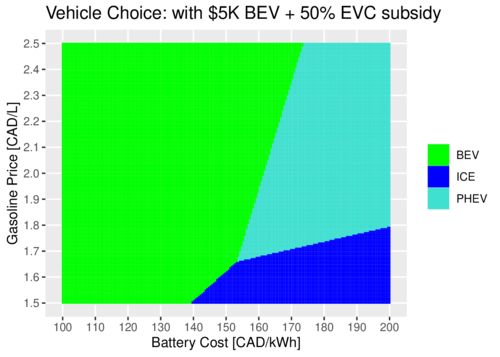
click on image for high-resolution PDF version
There are many assumptions in the above calculations that can be tweaked, or will change over time. The cost assumptions for the drivetrains do not include maintenance costs, which are assumed to be much less for BEVs and PHEVs than for ICE vehicles. A recent study from Consumer Reports found that PHEVs and BEVs cost only about half for maintenance than ICE vehicles. BEVs are known to have fewer parts, but even PHEVs have lower costs because their gasoline engine is used so much more sparingly.
The bottom line is that PHEVs remain a smart alternative both economically and environmentally. While not eliminating all emissions, PHEVs can achieve much of the benefit of BEVs while eliminating range anxiety. The main challenge is often the cost of installing EV charging infrastructure. The benefits of EV driving can only be fully realized if motorists have access to a convenient private EV charger, which supplies electricity at nominal rates. The key to the electrification of mobility is infrastructure development.
My calculations above rest on a fair number of assumptions. I can encourage you (and especially my students) to take the R code below and experiment with different parameters. How sensitive are the results to my assumptions? Which assumptions can be improved?
- Lawrence Ulrich: After Losing Favor to Electric Cars, Plug-In Hybrids Gain Ground, The New York Times, August 5, 2022.
- Mark Richardson: Hybrid, PHEV or BEV? Which kind of electric vehicle to choose depends on you. The Globe and Mail, May 10, 2021.
- Mark Cane: Compare Electric Cars: EV Range, Specs, Pricing & More, InsideEVs, July 1, 2022.
Recent Blog Entries
- Should data centres provide demand flexibility to protect BC's electricity grid? (June 8)
- Wind power is growing in British Columbia (June 5)
- Canada needs better rail, but not high-speed rail (June 2)
- How are Canada's electric vehicle imports trending? (May 9)
- The 2026 oil shock may become larger than you think (April 30)
- Improving road safety and saving lives with Leading Pedestrian Intervals (April 2)
- Where are BC's LNG exports sailing to? (March 27)
- Driving electric has become much more beneficial (March 17)
- Today's ruling by the U.S. Supreme Court won't end Trump's trade wars (February 20)
- America's Federal Reserve must stay independent (January 13)
- What good are stablecoins? (19 Dec 25)
- Canada's alcohol imports have shifted (27 Nov 25)
Topics
Months
Subscribe to RSS feed ![]()