At 6pm on December 19, 2022, British Columbia's electricity reached a new load peak with almost 12 Gigawatt [GW]. Below are some charts and numbers that illustrate how electricity load in British Columbia evolved over the last year. Most electricity in British Columbia is generate by BC Hydro, but there are also a number of independent power producers (mostly wind farms) and Fortis BC. The data below are for the entire Balancing Authority area [source]. BC Hydro is the Balancing Authority for British Columbia,
click on image for high-resolution PDF version
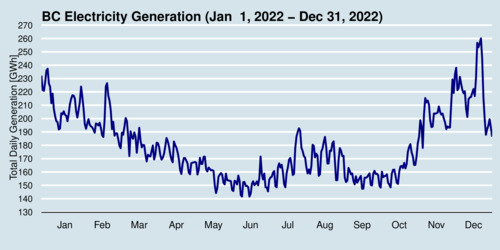
The chart above shows the daily electricity generation in Gigawatthours [GWh] for each day in 2022. British Columbia remains a "winter-peaking" jurisdiction as electricity is used for heating. The load peak occurred on December 19, while the demand peak occurred two days later as was widely reported in the news. Load is generation, and the difference to demand is made up with exports and imports from neighbouring jurisdictions. Frigid temperatures can strain the electricity grid tremendously.
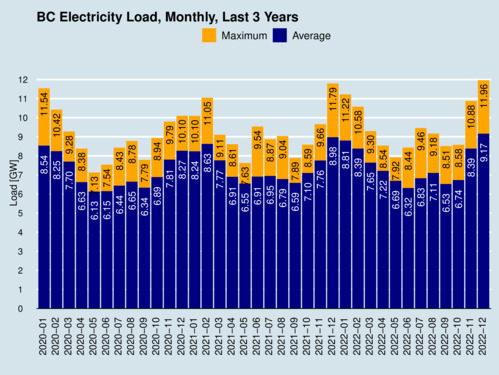
The next chart shows the monthly average and maximum load over the last three years in Gigawatts [GW]. Here the focus is on generating capacity, not electricity output [energy]. The blue bars show the average load, and the orange bars on top show the difference to the maximum load. Again, the chart shows that BC is a winter-peaking electricity jurisdiction, with peak loads typically occurring in December, January, or February.
click on image for high-resolution PDF version
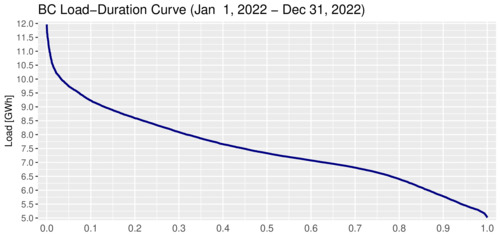
In electricity economics, we like to visualize the load distribution in a "load-duration curve" where each of the 8,760 hours of the year are lined up in descending order of load from left (highest) to right (lowest). The load-duration curve show nicely how the peak load on the left is relatively infrequent. Yet, the electricity system needs to provide this peak power when needed. Even though British Columbia only requires about 7.5 GW of capacity on average, we need at least 12 GW of capacity to satisfy peak demand, so roughly 60% more.
click on image for high-resolution PDF version
Lastly, the table below shows the system load averages, maximums, and minimums for each of the last 11 years. In 2022, there was a total of 65.54 TWh of electricity generated during the entire year. As there are 8,760 hours in a year, this is equivalent to an average load of 7.48 GW. IN 2022 we observed the highest demand peak at almost 12 GW, which is 1 GW more than demand peaks ten years ago. In other words, to satisfy the increasing peak demand, BC's electricity system had to add 1 GW of capacity to satisfy demand. The load minimum is perhaps less interesting, and it seems relatively stable over time near about 5 GW. It is also interesting to see the time of day when minimums and maximums occur. Minimum loads occur early in the morning, during the wee hours of the day. Maximum loads typically occur during the 18th hour or 19th hour of the day.
Load peaks are very much driven by weather conditions, and this relationship evolves due to climate change. I had written about this relationship in a previous blog How much more electricity does B.C. use when it gets cold?.
| Year | Average Load [GW] |
Annual Output [TWh] |
Maximum Load [GW] |
Maximum Load [Hour] |
Minimum Load [GW] |
Minimum Load [Hour] |
|---|---|---|---|---|---|---|
| 2012 | 6.89 | 60.50 | 10.92 | Jan 18, 18h | 4.58 | Jul 22, 06h |
| 2013 | 7.02 | 61.54 | 10.99 | Dec 9, 18h | 4.66 | Aug 19, 04h |
| 2014 | 7.06 | 61.85 | 10.67 | Feb 6, 19h | 4.82 | May 19, 04h |
| 2015 | 7.04 | 61.65 | 10.25 | Dec 30, 18h | 4.53 | Aug 30, 05h |
| 2016 | 7.11 | 62.42 | 10.99 | Dec 15, 18h | 4.95 | Aug 1, 04h |
| 2017 | 7.31 | 63.99 | 11.16 | Jan 3, 18h | 4.75 | Jul 2, 06h |
| 2018 | 7.21 | 63.14 | 10.49 | Jan 2, 18h | 5.01 | Jun 17, 06h |
| 2019 | 7.25 | 63.52 | 10.90 | Feb 11, 19h | 4.88 | Sep 12, 03h |
| 2020 | 7.15 | 62.80 | 11.54 | Jan 14, 18h | 4.69 | May 14, 04h |
| 2021 | 7.43 | 65.05 | 11.79 | Dec 27, 18h | 5.20 | Aug 17, 04h |
| 2022 | 7.48 | 65.54 | 11.96 | Dec 19, 18h | 5.02 | Jun 8, 06h |
Recent Blog Entries
- Should data centres provide demand flexibility to protect BC's electricity grid? (June 8)
- Wind power is growing in British Columbia (June 5)
- Canada needs better rail, but not high-speed rail (June 2)
- How are Canada's electric vehicle imports trending? (May 9)
- The 2026 oil shock may become larger than you think (April 30)
- Improving road safety and saving lives with Leading Pedestrian Intervals (April 2)
- Where are BC's LNG exports sailing to? (March 27)
- Driving electric has become much more beneficial (March 17)
- Today's ruling by the U.S. Supreme Court won't end Trump's trade wars (February 20)
- America's Federal Reserve must stay independent (January 13)
- What good are stablecoins? (19 Dec 25)
- Canada's alcohol imports have shifted (27 Nov 25)
Topics
Months
Subscribe to RSS feed ![]()