More and more people are buying electric vehicles, both the pure battery-electric type (BEV) and the plug-in hybrid type (PHEV). Much of this uptake takes place in urban areas as motorists in urban areas experience less "range anxiety" than motorists in rural areas. "Urban" is defined here as Statistics Canada does as any area with a population density large than 400 people per square kilometer.
When it comes to technological change where one type of product displaces another product over time, economists often use a logistic growth model to capture the transition. Essentially, the share \(s_t\) of the new product at time \(t\) is captured by \[s_t = \frac{1}{1+\exp(-\alpha\cdot(t-\beta))}\] where \(\alpha\) is a positive parameter, and \(\beta\) is the time period in which the growth rate reaches its peak and the adoption share is exactly 50%. While this equation appears non-linear, it can be estimated as a simple linear regression when the shares are transformed as follows: \[ \mathrm{logit}(s_t)\equiv \ln\left(\frac{s_t}{1-s_t}\right) = \alpha\cdot(t-\beta)\] Estimating this equation yields an intercept and a slope through which our parameters of interest \(\alpha\) and \(\beta\) can be backed out immediately. We can then take these estimates and project them forward, as I have done in the chart below, showing projection confidence intervals as a tan-colored ribbon behind the blue projection curve.
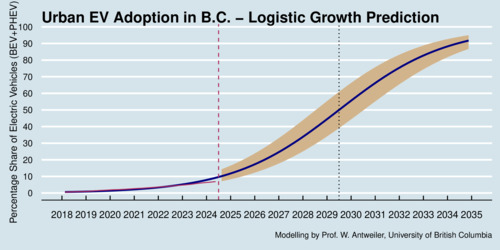
click on image for high-resolution PDF version
The regression is a good fit for the data, with very high statistical significance. My data points are based on the total number of BEVs and PHEVs as a share of all new vehicles in each quarter. All in all, I have 32 data points and goodness of fit (r-squared) of 0.975. The blue fit line deviates from the maroon-colored actual line only in the last two quarters of 2024, when EV adoption was lagging behind forecasts. A new trend or merely a hiccup in EV adoption? Time will tell. The dashed maroon-colored line shows where we are in the data space, right in the middle of 2024. The black dotted line shows where EV adoption in urban areas of BC reaches the 50%-mark: in mid-2029. The confidence interval is relatively wide, however: it ranges between 40% and 60%.
How does this compare with the targets for EV adoption set by the federal government through their Electric Vehicle Availability Standard? The table below shows the ZEV sales target for each model year (not calendar year). The model year is the year in which the vehicle is produced, not sold. Typically, though, new model years are introduced already in the fall of the preceding calendar year.
| Model Year | 2026 | 2027 | 2028 | 2029 | 2030 | 2031 | 2032 | 2033 | 2034 | 2035+ |
|---|---|---|---|---|---|---|---|---|---|---|
| ZEV Sales Target | 20% | 23% | 34% | 43% | 60% | 74% | 83% | 94% | 97% | 100% |
It looks like that urban areas may just about hit the 50% mark some time during 2029, which falls short of the ZEV mandate. There is also good reason to think that even with a 100% mandate past 2034 there will remain a market for gasoline-powered vehicles simply because of consumer preferences and a willingness to pay a premium for a gas-powered car.
My prediction for all of BC is a bit slower, but not by much, because urban areas account for the bulk of BC's population. My model predicts a 50%-mark for the entire fleet reached in early 2030.
If EV adoption does not reach the mandated level (i.e., the ZEV sales target becomes a binding constraint), excess gasoline-powered vehicles will face a penalty that is borne by the car maker and will likely be spread across all vehicles of that type produced by that car maker.
The logistic growth model estimated above does not take into account that policies may influence the outcome, either accelerate growth (in the presence of financial incentives) or slow down growth (when incentives are withdrawn). External factors (such as the price of gasoline or electricity) can also influence the outcome, and of course the pace of innovation in particular for EV batteries. The projections above merely extrapolate the current trend and should therefore be treated with some caution.
Economically, the key driver of EV prices is the cost of the EV battery. BloombergNEF reported in late 2023 that the average battery price continues to drop. Lithium-ion battery rack prices, which are the most common battery type in EVs, were said to hit a record low of US$139/kWh. BloombergNEF predicts that "technological innovation and manufacturing improvement should drive further declines in battery pack prices in the coming years, to US$113/kWh in 2025 and US$80/kWh in 2030." Often, the US$100/kWh is described as the point where EVs are expected to reach price parity with conventional vehicles. This price parity is for the upfront purchase price; the life-cycle cost of EVs is already lower in many instances.
Recent Blog Entries
- Should data centres provide demand flexibility to protect BC's electricity grid? (June 8)
- Wind power is growing in British Columbia (June 5)
- Canada needs better rail, but not high-speed rail (June 2)
- How are Canada's electric vehicle imports trending? (May 9)
- The 2026 oil shock may become larger than you think (April 30)
- Improving road safety and saving lives with Leading Pedestrian Intervals (April 2)
- Where are BC's LNG exports sailing to? (March 27)
- Driving electric has become much more beneficial (March 17)
- Today's ruling by the U.S. Supreme Court won't end Trump's trade wars (February 20)
- America's Federal Reserve must stay independent (January 13)
- What good are stablecoins? (19 Dec 25)
- Canada's alcohol imports have shifted (27 Nov 25)
Topics
Months
Subscribe to RSS feed ![]()