Exchange rate economics is a frustrating science: there is little that can be used reliably to forecast exchange rates. The best tool we have is purchasing power parity (PPP): in the long run, goods arbitrage ensures that the nominal exchange rate cannot stray too far from the parity. However, deviations from PPP can persist for an awfully long time. Canada's exchange rate is a bit special in another way: the Canadian Dollar is a petrocurrency. I have discussed The Canadian Petrodollar in a previous blog last April, with an update on February 22. However, not everyone seems convinced that the long-run relationship between the price of oil is the major driver of the US-Canada exchange rate over the last fifteen years.
Scott Barlow, a financial journalist and market strategist writing for the Globe and Mail, observed on May 24, 2016 in Here's what will drive the direction of the loonie in coming weeks:
The value of the domestic currency has almost exactly followed changes in relative yields. The mathematical correlation betweeen the two lines is extremely high – considerably higher than the correlation between the loonie and the oil price.
On March 10, 2016, Mr Barlow drew a more explicit comparison between the price of oil and the 2-year bond yield difference as predictors of the exchange rate. In Why I'm about to be redeemed after my wrong call on the loonie, he suggests that the bond yield is a better predictor than oil because the yield difference moves ahead of the price of oil. The empirics for the last year seems to point in that direction, and for short-term purposes this may well work better than the oil price, at times. Mr Barlow is careful to conclude:
Admittedly I'm speculating here, drawing conclusions from small samples of data. I still believe, however, that in global markets dominated by central-bank policy [...], bond markets provide the best forward-looking indicator for the Canadian dollar.
‘The forward rate is a poor predictor of the future spot rate.’
Economic theory usually makes the case along Mr Barlow's line, as we shall see in a moment. However, Canada is a bit special, and in fact there are two distinct questions here. First, do bond yield differences predict the current (spot) level of the exchange rate? The answer is: sometimes they do, and sometimes even very well and especially for particular country pairs. Second, do bond yield differences predict the future exchange rate? The answer is: no. The latter is actually a very old problem in exchange rate economics, known as the forward premium puzzle: the foward rate is a poor predictor of the future spot rate. It is generally not even a good predictor of the direction, let alone magnitude. While Mr Barlow's analysis is very useful, you should not take it as evidence that the Canadian Dollar is a "normal" currency. For better or worse, the loonie has become a petrocurrency. Before we look at the evidence, it is useful to recap a bit of economic theory. If you don't like the math, skip right ahead to the empirics below.
A bit of exchange rate theory
Bond yield differences and forward exchange rates are closely linked through the interest rate parity (IRP) mechanism. To introduce a bit of a notation, let \(X_t^0\) and \(X_t^f\) denote the spot rate and forward rate \(f\) years into the future. Then \[\frac{X_t^f}{X_t^0}=\left(\frac{1+i_f^\ast}{1+i_f}\right)^{f}\] where \(i_f^\ast\) and \(i_f\) are the foreign and domestic (riskless) yield for an \(f\)-year bond. The asterisk denotes "foreign". This equation is approximate because of different methods of interest compounding that could be used. Now let us also introduce \(z_t\equiv\ln(X_t^1/X_t^0) \) as the log forward premium (for a 1-year period) and define \(x_t\equiv\ln(X^0_t)\) as the log spot rate. We are interested in the simple linear relationship \[x_t=\alpha+\beta\cdot z_t+\epsilon_t \] where the forward premium predicts the level of the spot rate. Through IRP, this is exactly the same as looking at the 1-year bond yield differential. IRP arbitrage (which is very effective) ensures that the link between forward rate and yield differential is very tight. We can estimate the equation above easily, but over which time horizon: 1 year, 2 years, 5 years, 15 years? For an empirial relationship to be meaningful—confirming a theoretical prediction—this relationship has to be robust and must not depend on the time horizon.
The economic theory that links the level of the exchange rate to the interest rate differential is known as the Mussa (1976) present-value monetary model. The recent paper by Chen and Tsan (2013) provides a very good discussion of the links between yield curve and exchange rate predictability. The monetary model links uncovered interest rate parity and other fundamental economic factors to an asset (capital market) equilibrium and predicts that \[ X_t = U_t+\delta\mathcal{E}_t(X_{t+1}) \] where \(\delta\) is a discount factor, the operator \(\mathcal{E}_t\) captures the expectation at time \(t\) of next year's exchange rate, and \(U_t\) is an expression that collects all the bilateral differenes in economic fundamentals: \[ U_t = \phi_m\cdot(m^\ast_t-m_t)-\phi_y\cdot(y^\ast_t-y_t) -\phi_i\cdot(i^\ast_t-i_t)+\phi_\pi\cdot(\pi^\ast_t-\pi_t)\] The fundamental variables are money stock \(m\), output \(y\), interest rate \(i\), and inflation rate \(\pi\). The logic of the monetary model implies forward iteration: today's fundamentals and the expectation of tomorrow's exchange rate define today's exchange rate. And because the expectation of tomorrow's exchange rate depends on the expectation of tomorrow's fundamentals, it can be shown that \[ X_t =\lambda \sum_{i=0}^\infty \delta^i\mathcal{E}_t(G_{t+i}|\Omega_t) \] where we condition expectations on today's information, the information set \(\Omega_t\). A country's yield curve—which plots the interest rate of bonds against their maturity dates—is very good at absorbing information about these future states. The yield curve is also often referred to as the term structure of interest rates. The shape of the yield curve is often represented by the Nelson/Siegel (1987) factors, which are easy to estimate. The shape of the yield curve changes over time and is often used as an "early indicator" for macroeconomic changes.
Chen and Tsang (2013) also look at Canada in their empirial work. They find that "the Canadian-USD results appear to be the weakest among the currency pairs we looked at, and our conjecture is that it is mainly due to the Canadian dollar's ‘commodity currency’ status." While the monetary model delivers some degree of predictability for other countries, Canada's petrocurrency status muddies the waters. So let's look at the evidence.
From theory to empirics
Let us look at the empirical evidence a bit closer. The diagram below shows the exchange rate (red) and the forward premium (blue) between 2000 and early 2016. Not a good fit overall, but there are some periods when the two really move together.
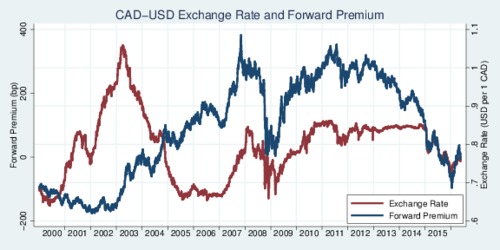
click on image for high-resolution PDF version
Let's zoom in a bit and only focus on the last ten years, from 2006 to 2016. Now we can see that during the financial crisis and around the years 2007-2010 there seems to be a fair bit of comovement. Then the curves drift apart again.
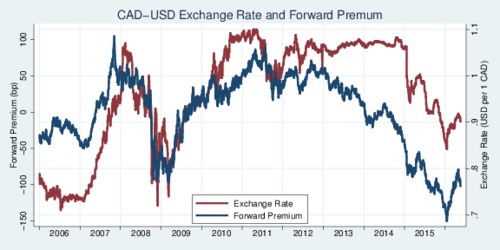
click on image for high-resolution PDF version
Let's zoom in yet further and only look at 2015 and the first months of 2016. Nice fit. When you run a regression analysis only on these few months, you would conclude that the forward premium is a good predictor of the exchange rate level. The fallacy is to extrapolate. Go back to the first diagram and you immediately see that this close relationship is only transient. Now you see it, next year you may, and a few years from now you probably won't.
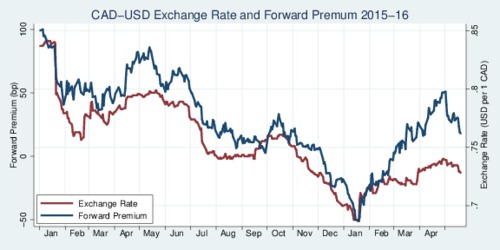
click on image for high-resolution PDF version
The three charts above are very suggestive: the relationship between the forward premium (and thus the yield curve difference) and the exchange rate is not robust. A bit more analysis helps to solidify this notion. I have taken the daily exchange rate data from CANSIM Table 176-0067 and analyzed the USD-CAD 1-year foward and spot rate by estimating a 2-year (730-day) rolling regression of the spot rate on the forward premium. I have repeated the regression by shifting forward 7 days at a time. The first data point in the chart below corresponds to the 2000-2001 period. The curve in that chart shows the R-square (i.e., the goodness of fit) for the regression. It swings wildly, from about 0.5 to zero and forth and back. Remarkably, towards the end of 2015, we get a near perfect fit. This is what prompted Mr Barlow to reflect on the usefulness of the relationship.
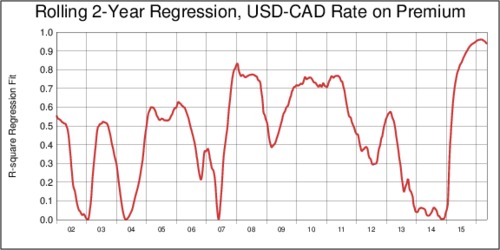
click on image for high-resolution PDF version
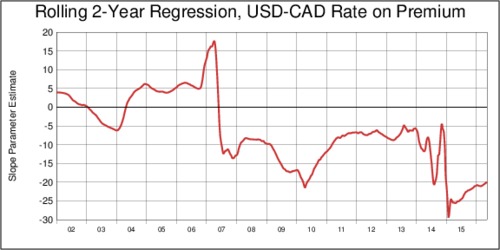
The gyrations in terms of goodnes-of-fit could be noise, but the instability of the slope parameter is a more serious matter. The next chart below shows that the \(\beta\) parameter in the regression is sometimes positive, sometimes negative, and wonders around aimlessly. Econometricians would call this "lack of robustness".
The lack of statistical robustness does not mean that bond yields do not matter. Nobody would doubt that central banks exert great influence over bond yields and thus, indirectly, the exchange rate. However, this influence seems overshadowed by other events for some time. What we see in the data today is a phase were bond yields seem to be particularly strong at capturing economic fundamentals. But keep in mind that at the end of 2014, this relationship was virtually non-existent and has managed to go from near-zero statistical fit to near perfect statistical fit in less than a year.
click on image for high-resolution PDF version
What we learn from the analysis above is that the term structure of interest is not very useful for predicting the CAD-USD exchange rate. The appearance of comovement is transient. And that is quite different from the link between oil prices and the exchange rate, which is statistically robust.
So how useful are bond yield differentials for predicting the US-Canada exchange rate?
‘For the foreseeable future, Canada cannot escape the petrodollar trap.’
Bond yield differentials often work well for telling us something about the level of the exchange rate—because yield curves are very good at summarizing information about expectations of the economy. See Ang and Chen (2010), for example. But what good does that do if we cannot predict the yield differentials? We do know that ultimately yield differentials are driven by central bank policyl, but we should be mindful that even central bank policy is not exogenous. Central bank policy reacts to economic fundamentals, and these in turn are driven by a number of global factors: oil prices among them. For that reason, watch the announcements of the Fed (interest rates are slowly rising) and the Bank of Canada (interest rates are staying flat). For the foreseeable future, Canada cannot escape the petrodollar trap. The link between the oil price and the USD-CAD exchange rate is statistically robust; the link between the yield difference and the USD-CAD exchange rate is not.
Can we do more empirically with the yield difference?
The econometrics shown above is very casual. It only makes use of the one-year forward rate. Recall that there are numerous forward rates because forward contracts exist at many different maturity dates: 1-month, 3-month, 6-month, 1 year, 2 years, and so on, usually up to 10 years. Or one can indeed match bond yield differences. In other words, we can match the yield curves of both countries and construct a set of data points for each maturity date for each observation date. Mr Barlow used 2-year bond yields in his chart; I have use ony 1-year forward rates. Arguably, the bilateral yield curve differential would provide much more useful information that has not been harvested here. Perhaps it could also explain more about why the 1-year forward premium provide a rather unstable prediction. Obviously, it would also be interesting to see how changes in commodity prices (as well as forward commodity prices) influence the bilateral yield curve differential. Rich ground for scholars to sink their econometric teeth into data.
Further readings:
- Yu-chin Chen and Kwok Ping Tsang: What Does the Yield Curve Tell Us about Exchange Rate Predictability?, The Review of Economics and Statistics 95(1), March 2013, pp. 185-205.
- Andrew Ang and Joseph Chen: Yield Curve Predictors of Foreign Exchange Returns, SSRN Working Paper 1542342, March 2010.
- Charles R. Nelson and Andrew F. Siegel: Parsimonious Modeling of Yield Curves, The Journal of Business 60(4), October 1987, pp. 473-489.
Recent Blog Entries
- Should data centres provide demand flexibility to protect BC's electricity grid? (June 8)
- Wind power is growing in British Columbia (June 5)
- Canada needs better rail, but not high-speed rail (June 2)
- How are Canada's electric vehicle imports trending? (May 9)
- The 2026 oil shock may become larger than you think (April 30)
- Improving road safety and saving lives with Leading Pedestrian Intervals (April 2)
- Where are BC's LNG exports sailing to? (March 27)
- Driving electric has become much more beneficial (March 17)
- Today's ruling by the U.S. Supreme Court won't end Trump's trade wars (February 20)
- America's Federal Reserve must stay independent (January 13)
- What good are stablecoins? (19 Dec 25)
- Canada's alcohol imports have shifted (27 Nov 25)
Topics
Months
Subscribe to RSS feed ![]()