The COVID-19 pandemic has significantly depressed economic activity while unemployment has been rising to unprecedented levels. One might think that the economic slowdown would have also translated into significantly less electricity use, but an analysis that I conducted shows that the displacement is relatively benign. The displacement between March 16 and May 14 comes to just about 4 per cent in British Columbia. By comparison, traffic volume was down 40%-60% on major roads in the province. What explains the small change in electricity use?
Just looking at the blue line in the graph below that shows actual daily electricity use, demand fell from about 190 Gigawatthours [GWh] at the beginning of the economic lock-down around March 16 to about 150 GWh by early May. Yet most of this apparent decrease is entirely seasonal. The green line in the graph below shows the number of Heating Degree Days [HDD], the hourly average of degrees below 18°C during each day. As the weather is getting warmer, electricity use for home heating is dropping as well. Importantly, though, the pandemic has made more people stay at home, and thus the relationship between HDD and electricity use has shifted from workplace heating to home heating, and the latter is less efficient.
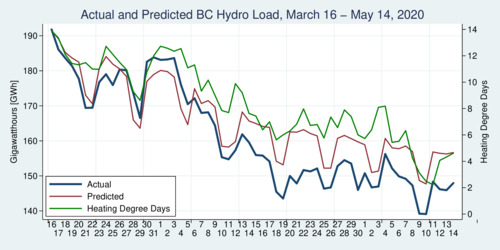
click on image for high-resolution PDF version
I have modeled electricity demand in British Columbia using daily data from 2015 through 2019—five years worth of data, or 1,825 data points. The estimation model I use regresses the logarithm of electricity demand on indicator variables for each day of the week, a civic holiday indicator, a linear time trend, the number of HDDs (linear and squared), and lastly eight seasonal factors (a fourth-order Fast Fourier Transformation). This model has a model fit—the regression R2—of 94%, which means that my model can explain most of the variation that we see in electricity demand in British Columbia. This is what is shown in the red line in the graph above. The difference between the blue and the red line is the deviation that can be attributed to the current circumstances.
The graph below shows the load displacement since March 16, 2020 expressed as a percentage rather than an absolute load. During March the changes were small, and during the first week of April demand was actually higher than expected. For most of April and May electricity demand has been down between 3% and 8%.
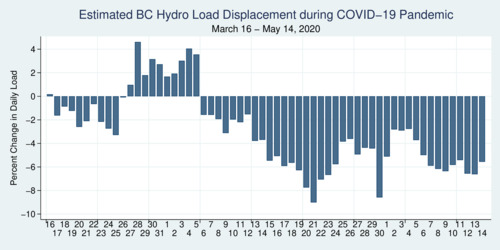
click on image for high-resolution PDF version
The factor that explains the increase in demand during late March and the first week of April is the shift from workplace demand to home demand. As the weather was colder during that period, HDDs were up. This means that more people were heating their homes, which is less efficient than providing heat at workplaces. The higher demand shown in the graph above is not a statistical error but in fact reveals the change in composition of demand. As the weather was warming up during the remainder of April and early May, home heating demand has fallen, and thus the full effect of the lowered economic activity has become more apparent in electricity demand as well.
A recent report from BC Hydro estimated that electricity demand in B.C. is nearly 10% lower. That number is about twice as large compared to what I have estimated for the time period since the beginning of the economic lock-down around March 16. Even ignoring the time period until April 6 still reveals a lower number than what BC Hydro reported on May 11: about 6% for the time period from April 6 through May 14. Keep in mind that BC Hydro cannot measure the load displacement—it requires an econometric model, and BC Hydro has not revealed their model.
There is a small empirical caveat in my analysis. I use Heating Degree Days for Vancouver, as I don't have regionally disaggregated load data. Because regional heterogeneity in weather also impacts electricity demand, I am unable to account for this geographic dispersion effect. Nevertheless, my model captures 94% of the variation already, so the extra gain from capturing regional heterogeneity cannot be all that significant.
Even though my analysis suggests that the adverse effect on BC Hydro is more benign than even BC Hydro seems to believe, this does not mean that BC Hydro is not facing significant challenges. BC Hydro worries that by April 2021 they may lose more than 12% of total demand. This would require them to scale down operations at some of their smaller plants and even drain excess water from some of their reservoirs. More important from a financial perspective will be decreased exports to the United States, usually a profitable operation when exports peak along with hot summers in California. The financial impact of COVID-19 will be significant, as BC Hydro was relying on a steady revenue stream to upgrade their aging transmission system. Yet, BC Hydro is also incredibly resilient. Capital planning is measured in decades, not years, and the mechanisms are in place to adjust to changed circumstances.
Overall, many electric utilities are fairing remarkably well during the COVID-19 pandemic. BC Hydro's counterparts in other provinces that are publicly-traded companies seem to be able to weather the storm. Their stock prices have largely been undented by the current crisis—especially companies such as Algonquin Power and Northland Power that have a significant green portfolio.
Further readings and information sources:
- BC Hydro News Release: Report: COVID-19 leads to drop in power usage and operational challenges for BC Hydro, May 11, 2020.
- BC Hydro: Demand dilemma: How BC Hydro is responding to declining load and operational challenges resulting from COVID-19, May 2020
- Jon Hernandez: BC Hydro electricity demand down 10% amid COVID-19 pandemic, CBC News, May 11, 2020.
Recent Blog Entries
- Should data centres provide demand flexibility to protect BC's electricity grid? (June 8)
- Wind power is growing in British Columbia (June 5)
- Canada needs better rail, but not high-speed rail (June 2)
- How are Canada's electric vehicle imports trending? (May 9)
- The 2026 oil shock may become larger than you think (April 30)
- Improving road safety and saving lives with Leading Pedestrian Intervals (April 2)
- Where are BC's LNG exports sailing to? (March 27)
- Driving electric has become much more beneficial (March 17)
- Today's ruling by the U.S. Supreme Court won't end Trump's trade wars (February 20)
- America's Federal Reserve must stay independent (January 13)
- What good are stablecoins? (19 Dec 25)
- Canada's alcohol imports have shifted (27 Nov 25)
Topics
Months
Subscribe to RSS feed ![]()