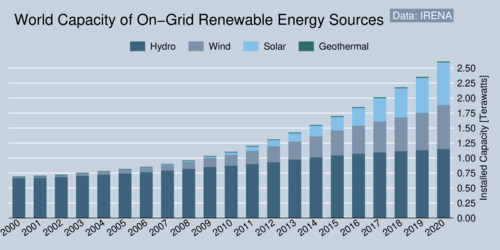
The last two decades have seen a massive expansion of renewable energy around the world. Since 2000, capacity more than tripled and has surpassed 2.5 Terawatts in 2020, according to statistics from the International Renewable Energy Agency (IRENA). Yet, this impressive increase can only be the start if the world is going to meet net-zero greenhouse gas emissions by the middle of this century. The collection of charts I have prepared below show how these massive changes have evolved over time, for different types of renewable energy.
The first graph shows the overall increase in renewable energy sources. In 2000, the only significant source of renewable energy was hydroelectricity, but first wind energy and then solar energy have sped up significantly and together they now rival hydroelectricity in importance. Meanwhile, electricity from geothermal energy only provides a very small share.
click on image for high-resolution PDF version
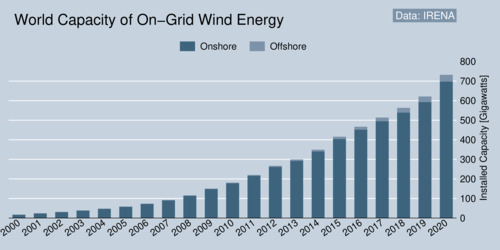
Wind power has grown steadily over the last twenty years. Expansion remains dominated by on-shore installations, but off-shore installations have grown in relative importance in the last few years. The cost of off-shore wind tended to be higher than on-shore because of the additional cost for foundations, connections to the power grid, and the engineering difficulties of installing turbines at sea. On the other hand, wind is stronger off-shore, while suitable on-land locations are becoming fewer. Off-shore wind power will play a significantly more important role in the next decades.
click on image for high-resolution PDF version
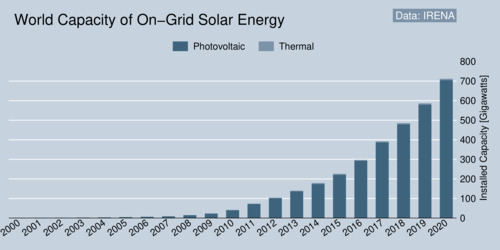
The growth of solar power has started about a decade after wind power. Most capacity has been installed only in the last decade, but growth is accelerating faster than for wind. There are good reasons for this. The cost of photovoltaic (PV) cells has come down hugely in the last ten years, making solar power competitive in terms of its levelized cost in numerous locations. If the world wants to wean itself off fossil fuels, this trend needs to accelerate significantly and vastly eclipse wind power. As the diagram shows, solar power is about to eclipse wind power for the first time in in 2021. Solar thermal installations play an insignificant role; virtually all new solar power is PV-based.
click on image for high-resolution PDF version
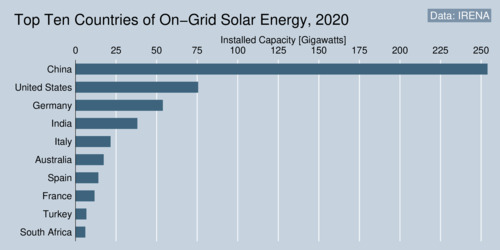
Staying with solar power, where is solar making the most rapid progress? The answer is China, leading all other nations by a wide margin. The next largest solar power countries are the United States, Germany, and India. China also has the largest solar power plants in the world. The world's largest plant to date, the Gonghe plant in China, has 2.2 Gigawatts (GW) nominal capacity and covers more than 5,000 hectares of land. This is an interesting benchmark for consideration of the land use that is ultimately needed to cover more of thew world's energy needs. It implies a ratio of 0.44 MW/ha. Other plants, for example the Sweihan Power Project in Abu Dhabi, require more space; it has a 1.17 MW/ha ratio. Of course, a solar panel does not generate continuous output. Equally interesting is the energy output per land unit, and with a typical capacity utilization rate of 20%, a 1 MW/ha capacity-land ratio implies 1.75 GWh/ha annual output. We also use the inverse to characterize land use: how much land is needed for one Gigawatthour of electricity per year? With a 1 ha/MW ratio, one GWh requires about 0.57 hectares. To make this comparable to British Columbian, consider that BC Hydro's Site C Dam will generate 5,100 Gwh per year. An equivalent solar farm would need 2907 hectares of land (i.e., 29 square kilometers). Of course, the sun doesn't shine as reliably in British Columbia as in Abu Dhabi, so the comparison is only for visualizing land use. If the installation was as efficient as Gonghe, land use would be cut in half.
click on image for high-resolution PDF version
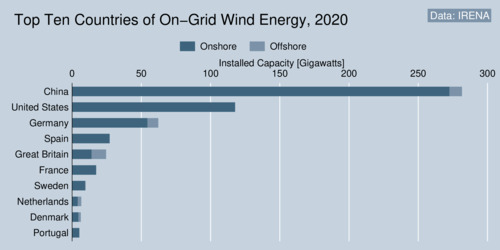
The next chart shows the top-ten ranking of on-grid wind energy. The top three spots are held by the same countries as for on-grid solar energy: China, the United States, and Germany. Further down the list several European countries also hold prominent spots, including Spain, Great Britain, and France. These are countries with favourable coast lines and wind conditions. China's dominance in wind power reflects more than the size of its economy. It is a combination of industrial policy and environmental need. Environmentally, China is eager to reduce its dependence on coal and all the pollution that comes with it. As industrial policy, China aims to become a world leader in technologies that will define the 21st century.
click on image for high-resolution PDF version
One remarkable aspect is the recent increase in off-shore wind. Britain has become the leader in this field, in part due to its favourable location as an island with lots of coast line and windy conditions. While the cost of off-shore installations used to be significantly larger than for on-shore installations, the cost has started to drop as turbines have become larger and the fixed costs of installations amortize more favourable. Technology has also advanced to make off-shore installations more and more practical even beyond shallow seas. It is even possible to install floating wind turbines that are merely anchored to the bottom of the sea.
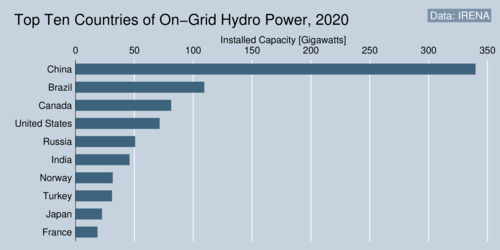
China is also the largest hydro power in the world with nearly 350 Gigawatts of capacity. The number two and three spots go to Brazil and Canada. As I reported in my previous blog on electricity generation country profiles, Canada relies on hydro power as its primary source for electricity. Brazil also relies mostly on hydro power, but in the last decade has not brought significant new capacity online. Brazil has expanded its use of fossil fuels instead to satisfy growing demand from a growing population.
click on image for high-resolution PDF version
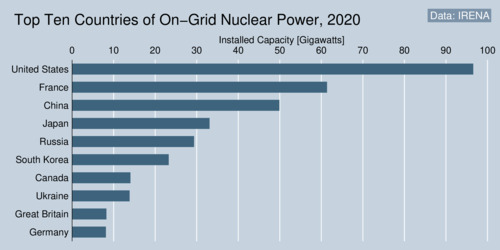
Moving away from renewable energy sources, but still looking at carbon-free energy sources, It is useful to consider the state of nuclear power around the world. Here the United States holds the top spot, followed by France and China. Japan's nuclear capacity would makes it fourth on the list, but since the Fukushima Daiichi disaster in 2011, nuclear generation remains small. France relies to about 70% on nuclear power and today has some of the lowest electricity prices. Nuclear power has turned France from being an electricity importer into an energy exporter. Most reactors were built in the 1970 and 1980s, but no new reactors have come online in the last twenty years. In the United States, two new reactors are being built in Georgia (Vogtle 3 and Vogtle 4). The are expected to come online in 2022 at the earliest. Meanwhile, China is expected go deploy a significant number of new reactors (18) over the course of the next decade. Further projects are in planning stages.
click on image for high-resolution PDF version
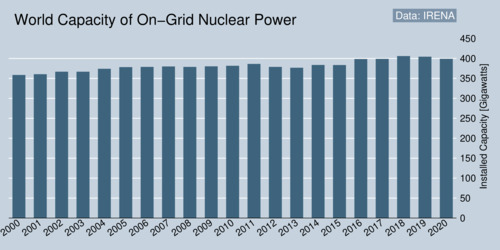
The last chart shows the growth of nuclear capacity over the last two decades. Except for China, there has been very little or no growth. The main reason is not the Fukushima disaster, but the relatively high cost. Questions about long-term storage of nuclear waste also impede further growth. Technological advances such as Advanced Small Modular Reactors could help bring about significant cost savings if they can be produced in larger numbers, subject to economies of scale, along with significant improvements in operational safety. Canada has a continued interest in this technology and has an SMR Action Plan.
click on image for high-resolution PDF version
The charts above help illustrate the dramatic increase in renewable energy supply over the last decade. In the quest to reduce our dependence on fossil fuels, this can only be the beginning. The world's annual electricity demand is about 25 Petawatthours (PWh), that is 25,000,000,000 Megawatthours (MWh), our roughly 3,200 kilowatthours (kWh) for every person on the planet.
According to IRENA, total output from renewable energy sources in 2019 came to just about 7 Petawatthours, or just over a quarter of total electricity supply. Of course, this is just for electricity, not the world's overall energy needs. It shows the scope of the task ahead in decarbonizing our economies.
Further information sources:
- International Energy Agency: Renewable Energy Market Update 2021, May 2021.
- International Renewable Energy Agency (IRENA): Renewable energy statistics 2021, August 2021.
- International Renewable Energy Agency (IRENA): Renewable Capacity Statistics 2021, March 2021.
Recent Blog Entries
- Should data centres provide demand flexibility to protect BC's electricity grid? (June 8)
- Wind power is growing in British Columbia (June 5)
- Canada needs better rail, but not high-speed rail (June 2)
- How are Canada's electric vehicle imports trending? (May 9)
- The 2026 oil shock may become larger than you think (April 30)
- Improving road safety and saving lives with Leading Pedestrian Intervals (April 2)
- Where are BC's LNG exports sailing to? (March 27)
- Driving electric has become much more beneficial (March 17)
- Today's ruling by the U.S. Supreme Court won't end Trump's trade wars (February 20)
- America's Federal Reserve must stay independent (January 13)
- What good are stablecoins? (19 Dec 25)
- Canada's alcohol imports have shifted (27 Nov 25)
Topics
Months
Subscribe to RSS feed ![]()