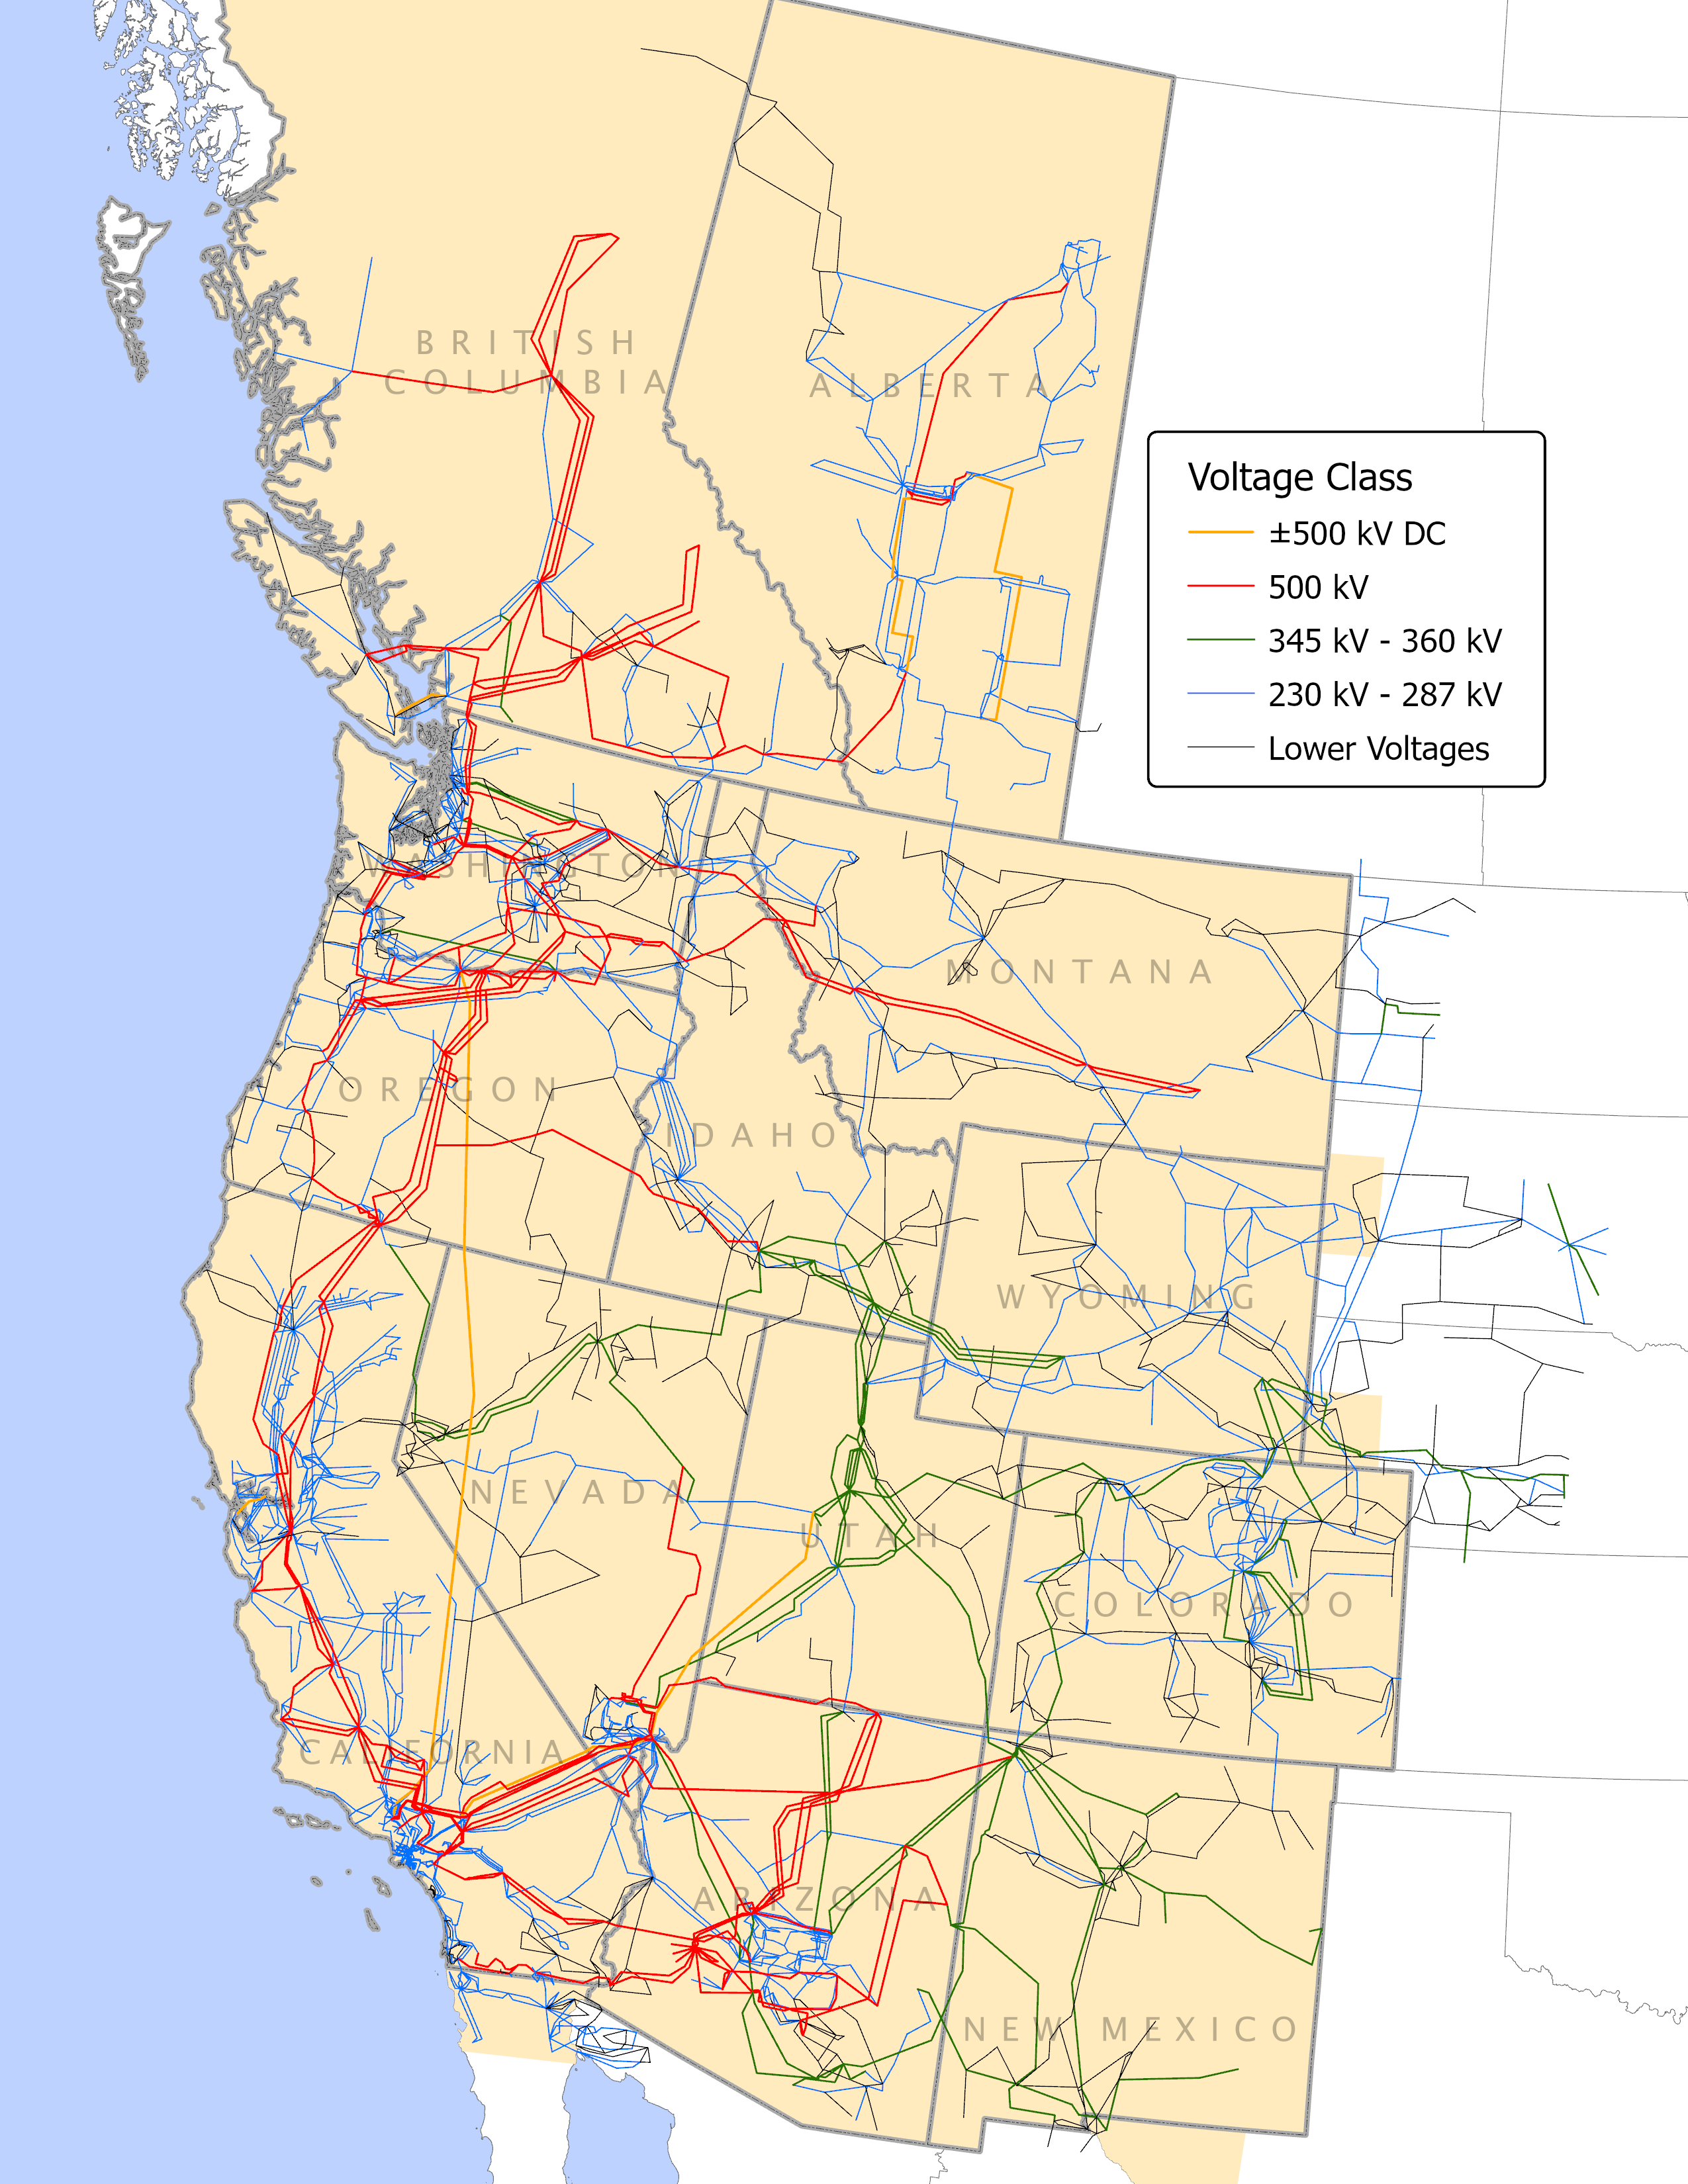
Canada's electricity trade with the United States is two-way trade: imports and exports take place in both directions, and often even at the very same time on different interties that connect our provinces with US states. I had written about this extensively in a research paper Cross-border trade in electricity in 2016. In today's blog I have a closer look at British Columbia's electricity trade with the United States. That's not all of BC's electricity trade because there is also trade with Alberta, but while the volume is well documented, value is not. Looking at BC-US electricity trade paints a picture where volume and value are distinctly different. In short, export prices tend to be above import prices, and this is very much to BC's advantage—thanks to skilled electricity traders at Powerex, a wholly-owned subsidiary of BC Hydro that manages trades with partners and customers across the Western Electric Coordinating Council (WECC) region. WECC's footprint extends from BC and Alberta across 14 Western states all the way to northern Baja California in Mexico, as shown in the map on the right.
Below I will first look at the historic trends spanning 25 years, using annual data, and then turn to the more recent developments in the last 36 months, using monthly data. There are five charts in each group. The first diagram shows export and import volumes by partner, followed by a diagram that shows exports and imports summed up as next exports. Next is a chart that shows export and import prices. The last two diagrams show exports and import dollar-values by partner, followed again by a diagram where export and import values are summed to show next exports in dollar terms.
What can we take away from all these charts? First, electricity trade is beneficial in both directions. We buy electricity when it is cheap, and sell it when it is expensive. Trade also helps stabilize electricity systems by balancing demand and supply in real time, and by allowing us to benefit from seasonal differences in supply and demand across different climate zones. Second, we see new challenges from climate change as drought conditions are impacting fuel supply (i.e., water) in British Columbia. And third, we can see that electricity trade may need to grow through capacity expansions wherever there is a strong business case that can be made.
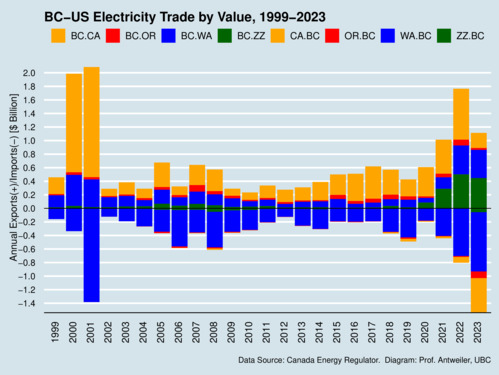
The first diagram below shows the annual volume of electricity exports (top half with positive numbers) and electricity imports (bottom half with negative numbers). BC's main trading partners in the United states are California (CA, orange), Oregon (OR, red), and Washington State (WA, blue). All remaining US states that BC is trading with are bundled into one group (ZZ, green). What the chart shows very clearly is that BC exports and imports at the same time. Much of our exports go to California, and much of our imports come from Washington State (the Bonneville Power Administration (BPA). The diagram also shows how 2023 stands out as the year with the largest total imports (over 16 Terawatthours [TWh]), and reduced exports.
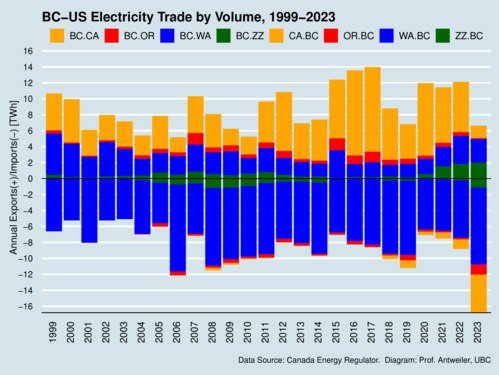
click on image for high-resolution PDF version
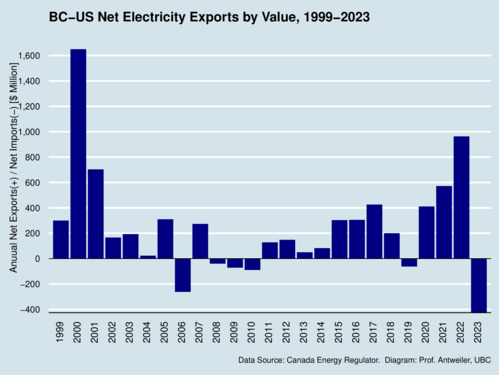
The second diagram sums up export and import volumes and reveals that British Columbia has been moving forth and back between being a net exporter and a net importer by volume. The year 2023 stands out as the one with the largest net imports: about 10 TWh—roughly 16 percent of total demand in BC. I had reported about this previously in my blog BC has become a net electricity importer in 2023. We are seeing the effects of climate change and drought conditions in BC.
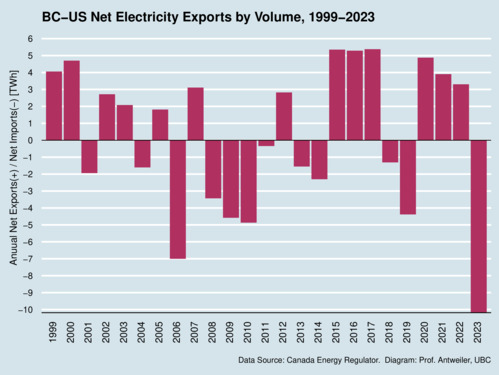
click on image for high-resolution PDF version
There are two sides to electricity trade: volume and value. What connects them are the market prices that are paid for exports and imports. The next chart shows the average export prices (maroon dots) and import prices (navy dots). The diagram shows that average export prices have always exceeded import prices. This is very beneficial to BC's economy—as well as BC Hydro customers. The gap between export and import prices can be large. During the 2000-2001 electricity crisis in California, when the state suffered from a shortfall of supply in part caused by market manipulations and capped retail prices, prices shot up dramatically. Notable is that since 2021, prices have been on the rise again. Average export prices in 2023 came in around $168/MWh, compared to import prices around $92/MWh.
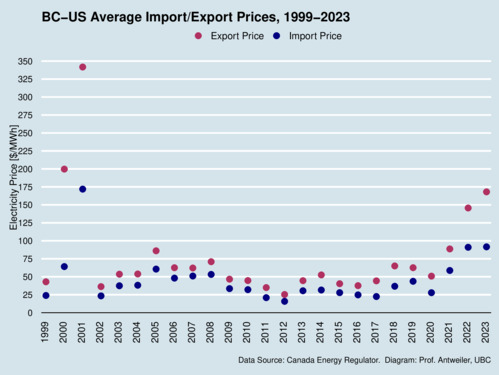
click on image for high-resolution PDF version
The price gap between exports and imports changes translates into a starkly different picture for export value and import value, compared trade volumes. The chart below shows how the crisis years of 2000-2001 stood out. BC profits much from exporting to California right through 2022. However, the picture changes in 2022 and 2023, when BC also benefits from exports to other US states, but also starts importing electricity from California.
click on image for high-resolution PDF version
The value chart above can be aggregated into net export values. While in 2022, BC gained nearly made one billion dollars, in 2023 BC lost 400 million. Whether these losses will trickle down to utility customers depends very much on how 2024 turns out. I will return to this question in a forthcoming blog.
click on image for high-resolution PDF version
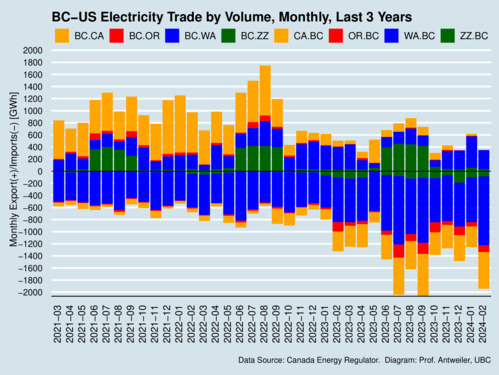
Having looked at the long term, let's turn to the short term and the trends over the last 36 months. This will also shed light on the seasonality of electricity imports and exports. BC is a winter-peaking jurisdiction because electricity is widely used for home heating. Demand is thus highest when it is coldest in the province. However, this seasonal variation in demand is not mirrored in our imports and exports. The diagram below shows that every month there are both significant imports and exports, driven in part by diurnal shifts in demand and supply. Significant increases in solar power supply in California drive down prices during the sunny hours and drive them up in the afternoon when the sun goes down and demand goes up. (This effect is known as the duck curve.)
A closer look at the diagram shows that electricity imports were quite high in the summer months, especially in July and September. That is when electricity demand is relatively low in BC. So what is going on? Think of BC's large hydro dams as big batteries, where the charge is the water level. By reducing output from the dams, water is effectively preserved for later use. BC can buy cheap solar power from California in the spring and summer, and export more valuable electricity in the winter, while at the same time addressing the drought conditions. When BC hit its demand peak on January 13 (see my blog BC Hydro's new peak load), BC was actually in a position to export electricity! A recent report from Powerex, Analysis of the January 2024 Winter Weather Event, discusses the interplay of supply and demand during the cold snap.
click on image for high-resolution PDF version
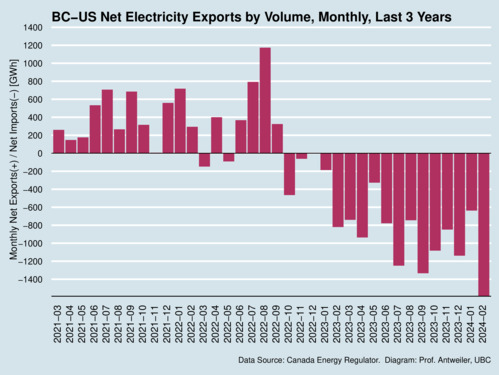
The effects of climate change are visible when exports and imports are tallied up as net exports (positive) or net imports (negative). Since January 2023, BC has become a continuous net importer of electricity. Drought conditions in BC have led to reservoirs receiving less rain and runoff than in previous years. The water shortage is a fuel (energy) shortage for our electricity system.
click on image for high-resolution PDF version
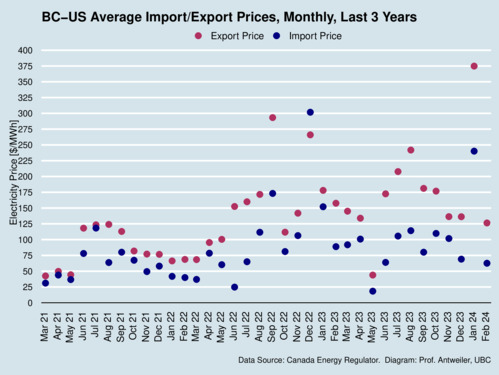
Export and import prices for electricity are much more volatile than the annual average suggested in the earlier diagram. The diagram below shows electricity prices over the last 36 months. We see average monthly import prices below $20/MWh (in June 2022) and average export prices as high as $375/MWh (in January 2024). There is a tendency for import prices to be at the low end in spring and early summer when electricity demand in California is not yet peaking (due to use of air conditioning) while solar output is already strong. When demand peaks in the winter in our northern latitudes, we also see electricity prices spiking. The highest export and import prices are usually observed during the cold season. What the chart does not show is that there are also price differences across different markets.
click on image for high-resolution PDF version
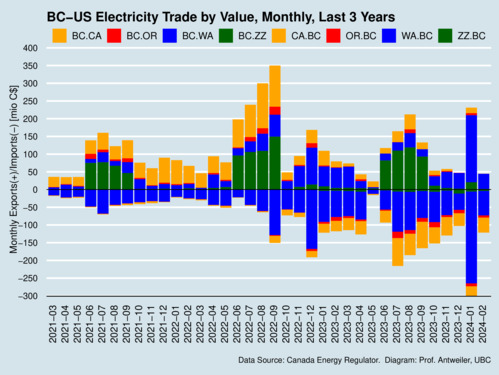
Turning from volume to value, the chart below shows the dollar value of exports and imports. The wild price swings observed in the previous chart imply that what we see as revenue from exports and costs from imports can vary hugely from one month to the next, even though volume hasn't changed too much. January 2024 stands out as a month with huge export and import values. But compare these to the volume chart, where we saw large net imports. The large price gap between exports and imports is clearly benefiting BC.
click on image for high-resolution PDF version
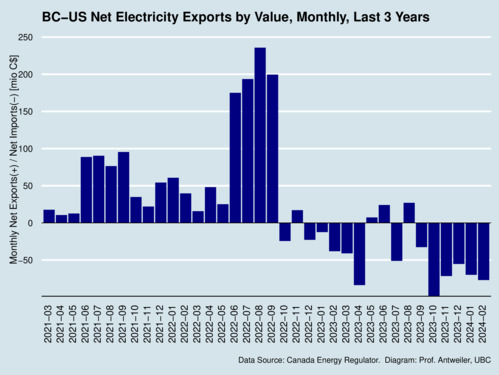
The last chart shows the value of net exports and net imports. June through September 2022 were highly profitable for BC. Since then, BC has seen mostly net imports in value, but these numbers look very manageable. Even in January 2024, when price spikes and volumes were extraordinary, BC managed to keep the cost down. In January 2024 the net cost to BC was barely larger than in the month before (despite the huge shift in volume) and even less than in October 2023. The takeaway here is that looking at export volumes and imports tells us very little about the economic impact. Value and volume can follow different paths at times.
click on image for high-resolution PDF version
The charts above show that BC-US electricity trade is no simple matter. Taking advantage of trading opportunities requires good forecasting and skilled finesse—tasks that the traders at Powerex are handling with aplomb. British Columbians owe them gratitude for keeping electricity prices low.
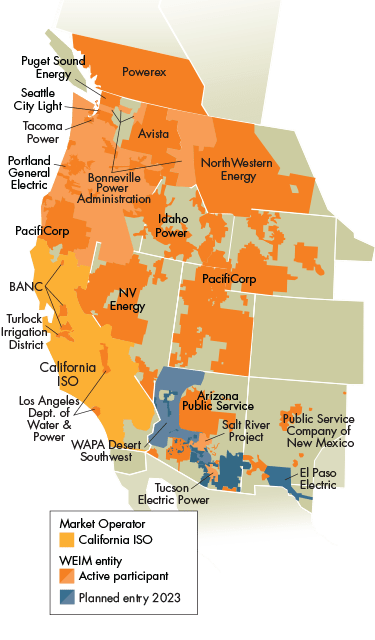
Can BC do even better? There are some notable innovations that are worth mentioning. First is the introduction of the Western Energy Imbalance Market (WEIM), a real-time energy-only wholesale energy trading market. Powerex joined the WEIM in April 2018. Markets are uniquely able to find efficiencies, and there is solid evidence that WEIM has generated substantial economic benefits to participants. At the core of the WEIM is California's Independent System Operator (CAISO), who opened the market to other participants. As the chart on the right shows, the WEIM now covers most of the Western Interconnections and is continuing to grow. What makes WEIM special is that it inter-regional, in contrast to the wholesale markets that are specific to a particular state or region. WEIM is crucially important to integrate renewable energy into our electric grid because it allows locations with excess supply to deliver energy to markets with excess demand (or storage capacity). One additional benefit is that a larger market allows for more renewable energy to enter the market and bring down carbon emissions. Yet another additional benefit is that a larger market provides greater grid reliability.
What else can be improved? Cooperation is crucial especially when it comes to ensuring resource adequacy, and for this purpose the Western Resource Adequacy Program (WRAP) was launched. WRAP is a forum for region-wide reliability planning, and for identifying capacity deficits. The peak demand event in January has also shown that the northwestern region would have benefited from additional import volumes, but access to resources in the Southwest and Rockies were limited by inter-regional transmission limitations (and even planned outages). Routing electricity from the Southwest to the Northwest through California faces its own challenges due to congestion charges. It appears that transmission upgrades that connect the Northwest and Southwest regions, without traversing California, would generate significant economic benefits to both regions.
There is another problem that needs solving. Electricity trade across the West faces "contract-path scheduling limits" on key transmission paths. A path is a major transmission corridor, typically between two neighbouring Balancing Authority Areas (BAAs), which have a physical flow limit; a "contract path" is a transmission path that can be designated to form a single continuous path between the parties to buying/selling contract. However, modern electricity markets do not put contract-path limits on top of flow-based transmission limits. Designing better markets would eliminate this problem.
Electricity markets come in pairs: a Day-Ahead Market (DAM) that lets market participants commit to buy or sell wholesale electricity one day before the operating day, thus reducing price volatility, and a Real-Time Market (RTM) that lets market participants buy and sell wholesale electricity during operations and which balances differences between day-ahead commitments and actual real-time energy demand. The existing WEIM is only one-half of the solution.
‘Joining the Markets+ Day-Ahead Market will generate economic benefits for B.C.’
Ideally, we should see the Western interconnection integrating into full-fledged regional day-ahead and real-time markets. The development of the Markets+ market, spearheaded by the Southwest Power Pool (SPP), is a major step in this direction. In March 2024, SPP asked the US regulator FERC to approve the platform, although some environmental groups have raised concerns about transparency and governance issues. Nevertheless, the arguments put together by the Bonneville Power Administration Day-Ahead Market Policy Paper from April 2024 show that Markets+ has many worthwhile advantages. California is also working on an Enhanced Day-Ahead Market (EDAM), essentially augmenting the existing WEIM. Our neighbours at the BPA, and I understand Powerex as well, see Market+ as the better option, with the reasons explained in the aforementioned policy paper.
The electricity world is changing in the Northwest, and there is considerable opportunity for better collaboration and new market structures. Climate change is a driving force from two sides. First, a changing climate, exemplified by drought conditions in BC, is putting new challenges on resource adequacy. We need to build a more resilient electric grid across the entire Western region. Second, climate change has spared an energy transition from fossil fuels to renewable alternatives. We need to integrate these new energy sources effectively, and this again works better across a wider grid where intermittent supply can be connected with the inherent storage ability of hydro-electric systems in the Northwest.
What is clear is that BC-US electricity trade is likely to grow, for the benefit of British Columbians, within the limitations of our current transmission capacity (Lines 5L51, 5L52, 2L112 and Teck Line 71). The benefits greatly outweigh the costs. Yes, we will be importing somewhat less clean electricity from across US states because of their particular generation mix, but even when a reasonable carbon price is put on these emissions implicit in imports from the US, the benefits prevail. The question that remains is under which conditions BC would benefit from greater transmission capacity to the US, whether through new interties or improving the use of existing interties—a topic for a future blog.
Recent Blog Entries
- Should data centres provide demand flexibility to protect BC's electricity grid? (June 8)
- Wind power is growing in British Columbia (June 5)
- Canada needs better rail, but not high-speed rail (June 2)
- How are Canada's electric vehicle imports trending? (May 9)
- The 2026 oil shock may become larger than you think (April 30)
- Improving road safety and saving lives with Leading Pedestrian Intervals (April 2)
- Where are BC's LNG exports sailing to? (March 27)
- Driving electric has become much more beneficial (March 17)
- Today's ruling by the U.S. Supreme Court won't end Trump's trade wars (February 20)
- America's Federal Reserve must stay independent (January 13)
- What good are stablecoins? (19 Dec 25)
- Canada's alcohol imports have shifted (27 Nov 25)
Topics
Months
Subscribe to RSS feed ![]()