I have looked into the question whether the Canadian Dollar is a petrocurrency in my blogs in April 2015 and May 2018. Both times the verdict was clear: the Canadian Dollar exchange rate to the U.S. Dollar exhibited strong responses to changes in the price of crude oil. I looked at it again, and it turns out that the Canadian Dollar is no longer showing strong signs of being a petrocurrency.
click on image for high-resolution PDF version
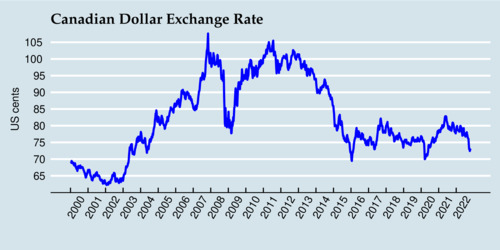
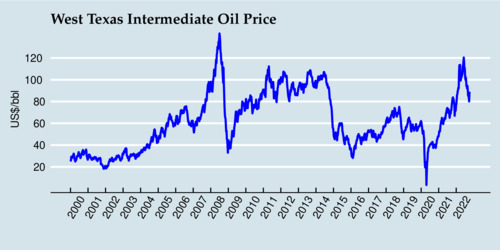
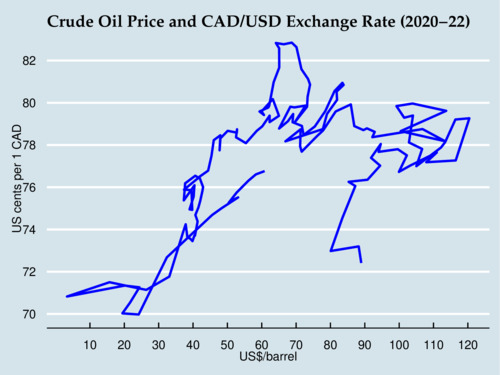
The diagram above shows the movement of the Canadian Dollar against the U.S. Dollar, and the diagram below shows the movement of the crude oil price (West Texas Intermediate, WTI), with weekly averages between 2000 and 2022.
click on image for high-resolution PDF version
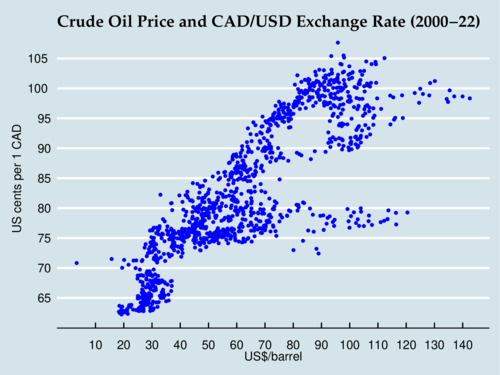
When all the data points are plotted in a diagram against each other, the strong correlation that persisted for many years can be seen in the steep diagonal line that extends from the bottom left to the top right. However, there are also "branches" visible in the diagram where the movement has been much flatter. So it appears that the pass-through from oil price to exchange rate changes over time, and is stronger during some periods than others.
click on image for high-resolution PDF version
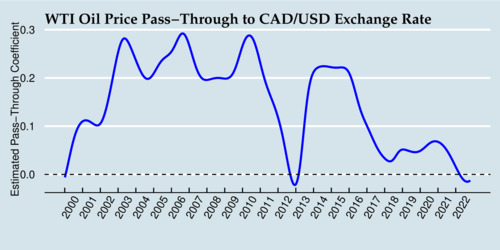
How large is the pass-through from the oil price to the exchange rate? We can estimate it with a simple type of "rolling regression", or use more sophisticated state-space models to quantify it. For the sake of simplicity, I use a simple linear regression \[\ln(x_t)=\alpha+\beta\ln(z_t)\] where \(x_t\) is the exchange rate (expressed in US cents per Canadian Dollar) and \(z_t\) is the crude oil price in US Dollars per barrel (USD/bbl), and \(t\) is the date (sequential week number). This log-linear regression estimates the pass-through elasticity \(\beta\). To estimate a time varying effect, I estimate this regression \(t\) times each time with different weights \[w_{t,s}=\frac{1}{1+\exp\left([|t-s|-\zeta]/\theta\right)} \] where \(s\) is the time period for which we estimate \(\alpha_s\) and \(\beta_s\), and the parameters \(\zeta=52\) and \(\theta=13\) provide the shape of the logistic two-side "smoother". The absolute value of \(|t-s|\) is the distance of data point from the "center" of the estimation, \(\zeta\) is the midpoint at which the weight is 1/2 (with 52 indicating 1 year), and \(\theta\) indicates how steep or flat the slope is at the midpoint. The results of this time-varying pass-through regression is shown below. This filter is both forward and backward looking, and at the end is only backward looking.
click on image for high-resolution PDF version
During the early 2000s through 2016, the Canadian Dollar showed strong signs of a petrocurrency effect, with a 10% increase in the price of crude oil translating into a 1-3 percent increase in the exchange rate. In 2012, this effect had vanished temporarily, only to resurface for a few more years. Since 2018, the pass-through elasticity is hovering close to zero, and during 2022 even ventured slightly into negative territory (although not in a statistically significant way). Clearly, the evidence shows a diminished or disappearing petrocurrency effect. The Canadian Dollar is not a clear case of showing petrocurrency behaviour.
So what has happened in the last three years? The diagram below shows the movements of the exchange rate and crude oil price since the beginning of 2000. Starting near 60 USD/bbl and 77 US cents, we see the effects of the pandemic driving down oil prices and exchange rates, followed by a recovery to 82 US cents and 65 USD/bbl by May 2021. By July 2021, the exchange rate has receded to 78 US cents, and oil prices start to climb while the exchange rate stays flat. After Russia launched its despicable war against Ukraine, oil prices topped out near 120 USD/bbl, but since then have receded to the mid-80 USD/bbl range. The steep drop in oil prices seems to be accompanied by a steep drop in the exchange rate. So there are still signs of petrocurrency behaviour.
click on image for high-resolution PDF version
For nearly two decades, the Canadian Dollar showed unambiguous signs of being a petrocurrency. This link has clearly weakened in recent years. In part it is driven by the resurgence of interest rate disparities between Canada and the United States (and the usual interest rate parity effect), and the US Dollar becoming more of a "safe haven" currency during times of war. It's too early to proclaim that the Canadian Dollar is not a petrodollar anymore. But we have clearly entered a time period where multiple factors compete with oil prices in determining the CAD/USD exchange rate. What we can be sure about is that we are in a time of higher volatility, and thus more exchange rate risk.
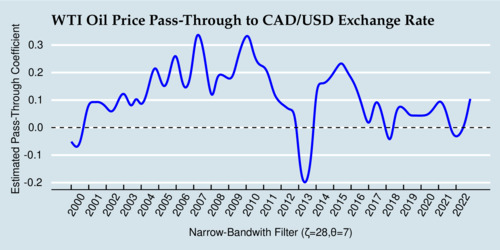
Lastly, I have also run the passthrough regressions using a narrow filter with a bandwidth of 28 weeks. The results are shown in the diagram below. It shows more variation in the passthrough elasticity, with larger swings and the noticeable passthrough reversion in 2013. Nevertheless, since about 2016, the passthrough elasticity remains between zero and 10%.
click on image for high-resolution PDF version
Recent Blog Entries
- Should data centres provide demand flexibility to protect BC's electricity grid? (June 8)
- Wind power is growing in British Columbia (June 5)
- Canada needs better rail, but not high-speed rail (June 2)
- How are Canada's electric vehicle imports trending? (May 9)
- The 2026 oil shock may become larger than you think (April 30)
- Improving road safety and saving lives with Leading Pedestrian Intervals (April 2)
- Where are BC's LNG exports sailing to? (March 27)
- Driving electric has become much more beneficial (March 17)
- Today's ruling by the U.S. Supreme Court won't end Trump's trade wars (February 20)
- America's Federal Reserve must stay independent (January 13)
- What good are stablecoins? (19 Dec 25)
- Canada's alcohol imports have shifted (27 Nov 25)
Topics
Months
Subscribe to RSS feed ![]()