Today marks the start of the 28th Conference of Parties of the United Nations Framework Convention on Climate Change, referred to commonly as COP28. It's time to take stock, and for that purpose today's blog will show diagrams of GHG emissions over time in Canada and across Canadian provinces. It's a picture of improvement in some places and worsening in other places. Overall, the picture is not pretty. Canada's overall greenhouse gas emissions have barely budged, and we need to understand why.
The charts below show greenhouse gas emissions as recorded in Canada's National GHG Inventory. Emissions are aggregated into sectors that are mostly self-explanatory. The "other" sector captures light manufacturing, construction, and forestry services.
The first chart shows the overall picture for Canada. Since about the year 2000, emissions have stagnated at 700 Megatonnes per year. Only during the pandemic year 2020 and post-pandemic year 2021 were emissions down a bit more, and during the recession year 2008. So overall this picture is not encouraging.
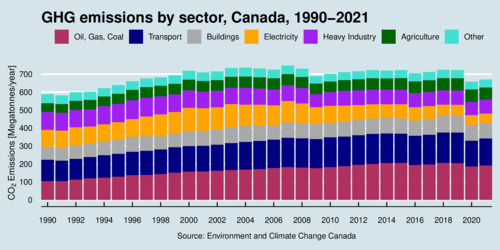
click on image for high-resolution PDF version
Let us turn to individual provinces, as climate policies differs substantially across provinces and the federal backstop policy only kicked in fully in 2019. First up: Ontario. Canada's largest province managed to phase out coal from its power grid, and this shows up in the orange bars starting to shrink rapidly. Emissions from heavy industry have also decreased.
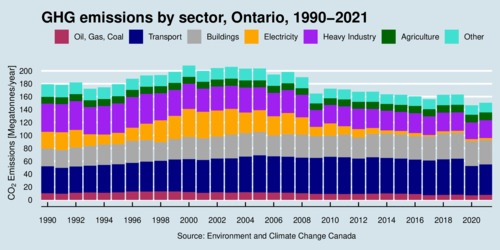
click on image for high-resolution PDF version
Quebec has a much smaller overall footprint than Ontario, because its electricity grid relies mostly on clean hydropower. This also benefits home heating. However, before the pandemic, Quebec's emissions started to rise despite joining a carbon cap-and-trade program with California.
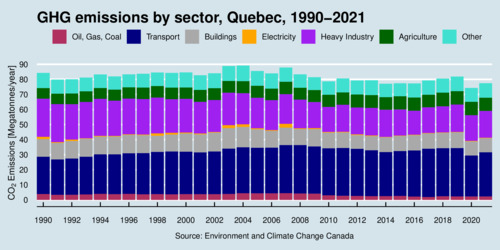
click on image for high-resolution PDF version
British Columbia is also flat-lining in terms of emissions and saw overall emissions creeping up before the pandemic, similar to Quebec. Just like Quebec, B.C. benefits from clean hydro electricity, but unlike Quebec, B.C. has an oil and gas industry.
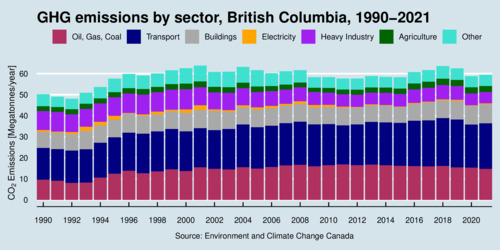
click on image for high-resolution PDF version
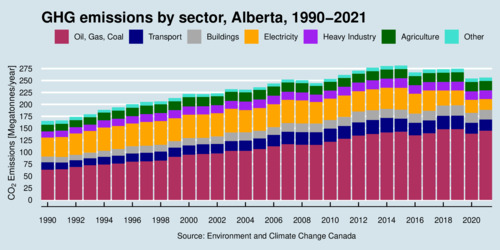
Alberta is Canada's carbon culprit: emissions are large and have been rising steadily due to the expansion of the oil and gas industry. The only area of improvement has been the power sector, as Alberta has largely replaced coal power with natural gas.
click on image for high-resolution PDF version
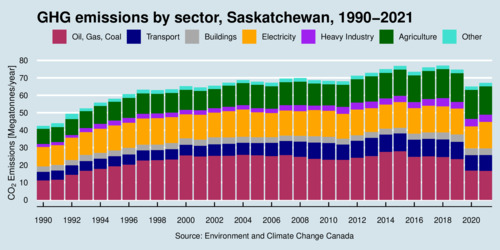
The province of Saskatchewan has Canada's largest footprint on a per-capita basis. The province has higher emissions than British Columbia even though it only has a quarter of that province's population. Saskatchewan has an oil and gas sector, it still relies heavily on coal for electricity generation and it also has large emissions from agriculture.x
click on image for high-resolution PDF version
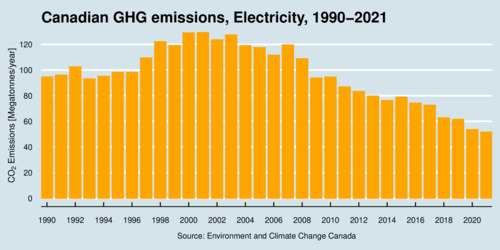
Let us return to Canada's overall emissions and look more closely at the industry-level emissions. Let's start with Canada's only success story for greenhouse gas reductions: the electricity sector. Mostly due to replacing coal with natural gas, emissions have been cut more than half. That is an important accomplishment, and the next stage of replacing natural gas with renewable energy sources is firmly in sight and is becoming increasingly affordable economically and feasible technologically.
click on image for high-resolution PDF version
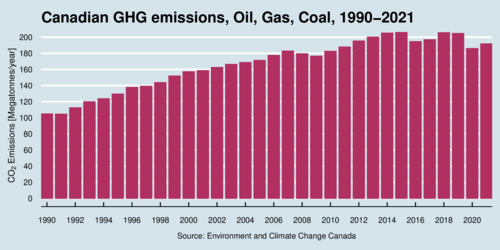
Canada's emissions from the oil and gas industry peaked at over 200 Megatonnes and have been slightly dampened by the pandemic. Perhaps the good news is that emissions have reached a plateau. It is clear that Canada will not be able to achieve its ambitions net-zero by 2050 goals without addressing these emissions drastically. Carbon capture and storage will need to play a major role to get these numbers down.
click on image for high-resolution PDF version
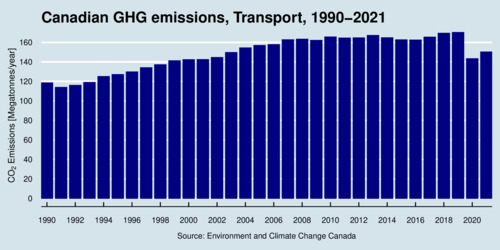
Despite carbon prices in some provinces, GHG emissions from transportation have risen prior to the pandemic, although slower in the last decade than in the previous two decades. What explains this stagnation?
click on image for high-resolution PDF version
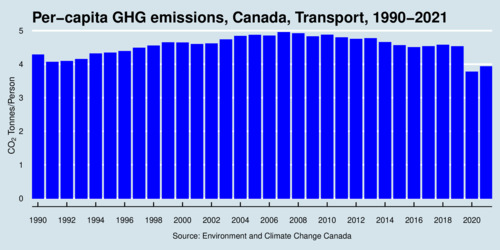
Transportation emissions, the bulk from personal transportation, can be decomposed into separate scale, composition, and technique effects. The scale is determined by population size and annual mileage per person. The composition effect captures transportation mode and vehicle fleet composition. The technique effect identifies how the emission intensity of vehicles changes over time. Public policy can affect all these components. A simple way of visualizing the major components involves expressing transportation emissions on a per-capita basis, shown in the next diagram. Here, the emission intensity is improving slightly since about 2006. Public policies seem to have a positive effect, although only gradually because fleet turnover is slow and driving behaviour is relatively price-inelastic. Canada's ZEV mandate is likely going to change this picture dramatically over the next decade.
click on image for high-resolution PDF version
As countries gather to discuss climate change at the COP28 meeting in Dubai, Canada is in no position to celebrate. The charts above show that Canada is not yet on a trajectory to meet its goals it signed to through the Paris Agreement. There is also no consensus across the political spectrum in Canada about the urgency of sustained or even accelerated climate action. Electoral outcomes may have profound impacts on the direction of climate policy in Canada.
Economists embrace efficient market-based climate policies that also address fairness and equity. The "first-best" instrument involves putting a price on the negative externality—carbon emissions—that is equal to its marginal damage: what is known as the social cost of carbon. Today's carbon price at $65/tonne appears to be well below that number, which experts calculate as a range centered around US$185/tonne (about $250/tonne in Canadian currency; see Canada's estimates). Even the federal government's $170/tonne goal for 2030 is likely insufficient to reach the goal of net-zero emissions by 2050. Yet, there appears little political appetite to accelerate the carbon pricing schedule, and some politicians have voiced ferocious opposition to carbon pricing in general.
Effective carbon pricing can be administered equitably by making it revenue neutral. The federal government's carbon pricing system, which applies in several provinces that do not have their own system such as Ontario and Alberta, returns rebates to all households through quarterly climate action incentive payments. British Columbia's carbon pricing system is more complex because it started off with income tax reductions to make it revenue neutral. More recent increases have been rebated to lower-income households in British Columbia through the quarterly climate action tax credit. The rebates address the income-regressivity of carbon pricing because energy expenses are a larger part of the budget of a lower-income household than a higher-income household. Canceling the carbon tax, as some politicians are demanding, would make lower-income households worse off and mostly benefit rich (and carbon-intensive) households.
Additional carbon policies are needed to address other market failures and market imperfections. For example, ZEV mandates are meant to boost the adoption of electric vehicles, and incentives for electric vehicle charging stations are meant to widen the network of private charging stations. Other incentive programs focus on home heating infrastructure (e.g., heat pumps) and energy efficiency. What these measures have in common is that they address issues where higher upfront fixed cost create a barrier to benefiting from lower long-term variable costs. There are numerous information barriers and institutional barriers that specific laws and regulations, as well as incentive programs, need to address.
At the start of COP28, the "elephant in the room" in Canada is the oil and gas industry. There can be no serious progress on reducing greenhouse gas emissions without changing this industry's carbon intensity dramatically, and reducing overall emissions. Today, only about 1.3 percent of emissions (about 2.7 Mtpa) from Canada's oil industry are captured and stored. Carbon Capture, Utilization and Storage (CCUS) remains expensive, upwards of $200/tonne, and federal and provincial governments have already spent $13 billion on CCUS support. Serious questions remain about the scalability of CCUS and its cost. If the CCUS remains too expensive, it cannot play the role it is envisioned to play. In the short term, the focus needs to be on reducing avoidable emissions (such as methane leakage), and on electrification of all electrifiable production infrastructure using renewable energy sources. To achieve the necessary emission reductions in the oil and gas sector, carbon emissions need to fully face a carbon price that is reflective of the social cost of carbon.
Climate change is already taking a toll on our society. Impactful and effective climate action is urgent. As the journal Nature reported on 10 November 2023: Earth just had its hottest year on record — climate change is to blame.
![[Sauder School of Business]](logo-ubc-sauder-2016.png)
![[The University of British Columbia]](logo-ubc-2016.png)