British Columbia's first large-scale liquefied natural gas (LNG) export terminal, LNG Canada, started shipping at the end of June 2025. So where are exports heading, based on the track record of the first few months of operation? The chart below shows monthly shipments leaving the port of Kitimat, BC. The volumes are reported in thousands of tonnes and are disaggregated by export destination. The dotted black line shows the nominal monthly capacity of the plant, 14 million tonnes per annum (MTPA) or about 1,160 thousand tonnes per month. As the chart shows, the plant still operates well below its capacity as the second liquefaction train only became operational only in November 2025. By February 2026, the first fifty cargo ships had left the port.
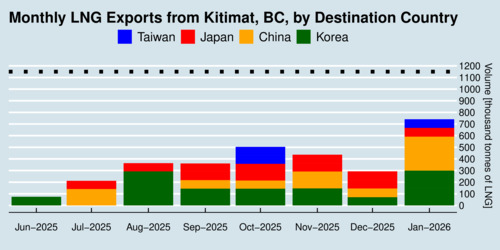
click on image for high-resolution PDF version
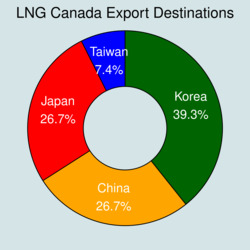
The largest share of exports, about two-fifth, currently go to South Korea. Mainland China and Japan receive about a quarter of shipments each, and the remaining 7 percent go to Taiwan. The data are from the Canada Energy Regulator (CER), but they only provide shipment volumes without information on the values or prices. Pricing information seems to be shrouded in secrecy, likely because of contract terms. Unlike oil, LNG is typically traded in long-term contracts, and the details of these contracts are not made public.So let's have a closer look at how LNG is priced in general, and what is publicly known about BC's LNG prices in international markets.
LNG is mostly traded through long-term contracts, but not exclusively. Some LNG is also traded in spot markets, and the major market benchmarks are the Dutch Title Transfer Facility (TTF) for Europe and the Japan Korea Marker (JKM) for Asia. Traditionally, long-term LNG contracts are indexed to the price of oil through a formula, especially for customers in Asia. There the LNG price is the sum of a constant element (known as the "add-on" or "biddable component") that covers the shipping and regasification cost, and a variable element that is the product of the oil price and a slope parameter. The slope is expressed as a percentage of the prevailing oil price, where the physical units for oil are US$/barrel and US$/mmBTU for gas (mmBTU stands for million British Thermal Units). For example, if the price of LNG is US$12/mmBTU and the price of oil is US$60/bbl, then the slope is 20%. Typical percentages found in LNG contracts are 13 to 15. Which indexes are used varies. For oil it is often Brent in Europe or the Japan Crude Cocktail (JCC) in Asia. More recent LNG contracts can also be linked to gas hub spot-price indexes such as the Henry Hub in the United States or TTF in the Netherlands. Yet others may use a hybrid model and have links to both gas and oil markets. On top of all of this are often price floors and price ceilings, or alternatively an "S-curve" formula that dampens price swings (with flatter slopes above an upper kink point and below a lower kink point).
Long-term LNG contracts often have provisions through which they can be renegotiated at regular but infrequent intervals. These provisions are known as "re-opener" or price review clauses in a contract. Another key feature of an LNG contract is the flexibility it may provide. Some contracts have "take-or-pay" clauses, which require a buyer to pay for a minimum quantity of LNG even if they do not take delivery. Some contracts prohibit re-exports to other markets. Another common feature is a quantity tolerance up or down. With an UQT/DQT clause a buyer can vary volume within specific limits, although this affects the final price.
LNG shipped from the United States follows yet another model, essentially an additive model with a direct one-to-one link to the Henry Hub index. Added to the hub price are a feed gas pipeline tariff, the liquefaction cost including energy retainage (around 10%), and the transportation and shipping cost.
All of the above means that the price of LNG in a long-term contract varies from month to month. Because of the link to spot prices for oil or gas or both, LNG markets are not immune to fluctuations from a variety of sources. But what does all of that mean for LNG prices from BC producers? Japan is one of the most liquid markets for LNG, and their import data shows volumes and prices from different importers. The table below shows Japan's average import prices for November and December of 2025.
Japan's LNG Imports in Nov/Dec 2025
| Origin Country | Import Share |
Price [US$/MWh] |
Price [US$/mmBTU] |
Price Premium |
|---|---|---|---|---|
| Australia | 35.8% | 35.71 | 10.49 | -0.3% |
| Malaysia | 12.7% | 34.32 | 10.08 | -4.2% |
| United States | 10.3% | 36.37 | 10.69 | 1.6% |
| Russia | 8.6% | 35.85 | 10.53 | 0.1% |
| Indonesia | 6.1% | 35.61 | 10.47 | -0.5% |
| Oman | 6.0% | 34.10 | 10.02 | -4.8% |
| Qatar | 4.8% | 39.86 | 11.71 | 11.3% |
| Bahrain | 4.6% | 34.94 | 10.27 | -2.4% |
| Papua New Guinea | 3.9% | 39.05 | 11.47 | 9.0% |
| Canada | 3.7% | 36.80 | 10.81 | 2.8% |
| Peru | 1.3% | 27.92 | 8.20 | -22.0% |
| Nigeria | 1.2% | 37.99 | 11.16 | 6.1% |
| Equatorial Guinea | 0.6% | 36.05 | 10.59 | 0.7% |
| United Arab Emeriates | 0.5% | 41.69 | 12.25 | 16.4% |
Japan gets more than a third of its LNG from Australia, followed by Malaysia, the United States, Russia, Indonesia and Oman. Canada's market share in Japan at the moment is only 3.7%. The table above shows significant variation in LNG import prices. The differences are caused by the type of contract, long-term versus spot, shipping cost differences, differences in the biddable component, differences in the contract slope for the link to the oil and gas reference price, as well as risk premiums. What stands out is that Canada's price is roughly the same as that of the United States, even though the transportation distance for LNG is longer as it has to travel from the export terminals along the Gulf of Mexico through the Panama Canal. Canada's LNG is essentially right in the middle, with a very slight premium over Japan's average import price. There are also noticeable outliers in the price structure. Malaysian LNG is the most competitive, in part because of a short shipping distance. Peruvian LNG is particularly cheap, likely discounted heavily because it may be a spot transaction. Note the high price premium for LNG from Qatar and the United Arab Emirates. These suppliers link their contracts to oil prices rather than gas hub prices, while contracts with the United States are linked to gas prices. These supplier countries also have preferred longer-term and rigid contracts. While this has locked in somewhat higher prices, these suppliers may lose market share against cheaper (or more reliable) competitors.
‘Geopolitical risk assessments may boost the fortunes of Canadian LNG. But with a glut of LNG expected by 2030, LNG from BC looks still pretty marginal economically.’
Whether LNG from British Columbia is profitable depends on how prices compare to costs. The production cost for LNG from British Columbia is thought to lie around US$7.50-8.50/mmBTU, roughly composed of US$2.50/mmBTU for the gas feedstock and US$5-6/mmBTU for liquefaction. Add another US$1/mmBTU for shipping, and the delivered cost is US$8.5-9.5/mmBTU. So at US$10.81 in Japan, there was a positive profit margin late last year. Today's spot prices for natural gas have escalated because of the war in the Middle East, and this means LNG is somewhat more profitable at the moment. However, price increases are dampened by the long-term contract structure. For LNG investments, it is the long-term outlook of prices that matters, not the current prices. There is significant new LNG capacity coming online over the next years (as these plants are already under construction and are post-FID). This expected supply glut is expected to depress long-term prices well below US$10/mmBTU. While forecasting the future is fraught with error, my sense is that oversupply by 2030 will jeopardize the economic viability of any new projects with a break-even cost that exceeds US$8.50/mmBTU, and this includes proposed projects in Canada.
Risks to global supply may shift perceptions of buyers, however. Canadian LNG may be viewed as less risky and more desirable than LNG from other sources. If buyers are willing to pay a price premium for supply security, the business case for Canadian LNG looks rosier even in a future era of oversupply, benefiting not from market growth but from gaining market share from competitors.
Bottom line: Canada's LNG today is marginally competitive today, but the risk of growing oversupply dampens the outlook considerably. Two major projects are awaiting final investment decisions in BC this year: Ksi Lisims and LNG Canada Phase 2. Last year my sense was that the odds for these projects reaching a positive final investment decision were less than even. Like it or not, Trump's ill-conceived Middle East war, which has cut off Qatar's LNG from world markets, has improved these odds noticeably. Yet whether these two projects move ahead is still far from uncertain.
The same geopolitical turn-towards-reliable-supplier effect is not true for Canadian oil, because oil is much more substitutable as it is traded in spot transactions globally. Rerouting oil is much less onerous than natural gas, as the latter is a vital input for electricity generation in many countries in Asia. Securing a steady and reliable supply is more important for gas than for oil.
Global LNG markets have grown spectacularly over the last decade, but that growth has peaked and Canada is a late-comer to this market. Don't expect Canada to become the "energy superpower" that politicians like to talk about. Canada is a major energy exporter, but still only one of many. For better or worse, Canada will remain an "energy middle power". Let's do what we do well, and always with an eye towards good environmental stewardship. With all that talk about oil and gas, the elephant in the room is still climate change.
Recent Blog Entries
- Should data centres provide demand flexibility to protect BC's electricity grid? (June 8)
- Wind power is growing in British Columbia (June 5)
- Canada needs better rail, but not high-speed rail (June 2)
- How are Canada's electric vehicle imports trending? (May 9)
- The 2026 oil shock may become larger than you think (April 30)
- Improving road safety and saving lives with Leading Pedestrian Intervals (April 2)
- Where are BC's LNG exports sailing to? (March 27)
- Driving electric has become much more beneficial (March 17)
- Today's ruling by the U.S. Supreme Court won't end Trump's trade wars (February 20)
- America's Federal Reserve must stay independent (January 13)
- What good are stablecoins? (19 Dec 25)
- Canada's alcohol imports have shifted (27 Nov 25)
Topics
Months
Subscribe to RSS feed ![]()